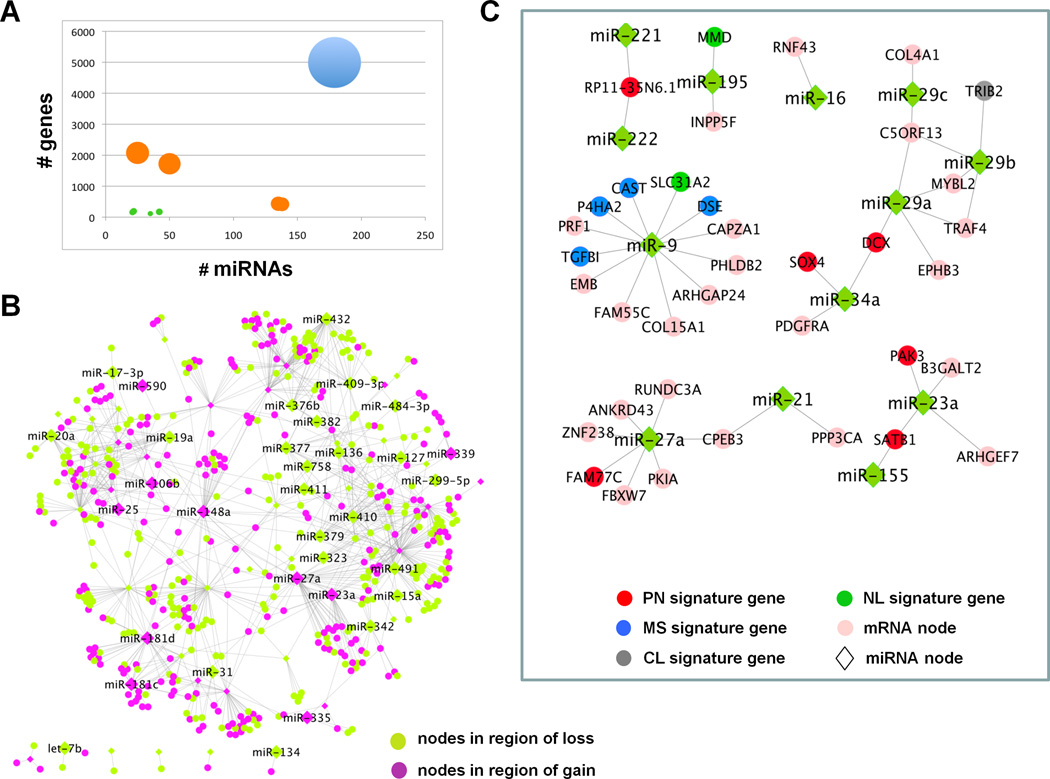
Figure 1. Integrative analyses of CLR network in context of copy number alterations and direct target prediction.
(A) CLR network grouped by connectivity among miRs and mRNAs in regions of copy number aberration. Size of the node represents the number of edges between the miR and mRNAs in each group. There are 9 sub-networks represented. Edges in the network where both participating miR and mRNA are in regions of copy number alterations account for less than 3.9% of the total connectivity (green circles). Edges where either the participating miR or the mRNA is in region of gain or loss, but not both, account for 34.1% of the network (orange circles). Approximately 62% of the network involves miRs and mRNAs without evidence of genomic alterations in GBM (blue circle). (B) Network of CLR edges where both miR (diamonds) and mRNA (circles) are in regions of copy number gain (purple nodes) or loss (green nodes). (C) Putative direct target subnetworks among CLR-identified edges in GBM. miRs are represented as green diamonds and genes as circles; classical signature genes (grey), neural signature genes (dark green), proneural signature genes (red), mesenchymal signature genes (blue), genes not in any of the molecular subtype signatures (pink). Abbreviations: PN= Proneural, MS=Mesenchymal, CL=Classical, NL=Neural.

