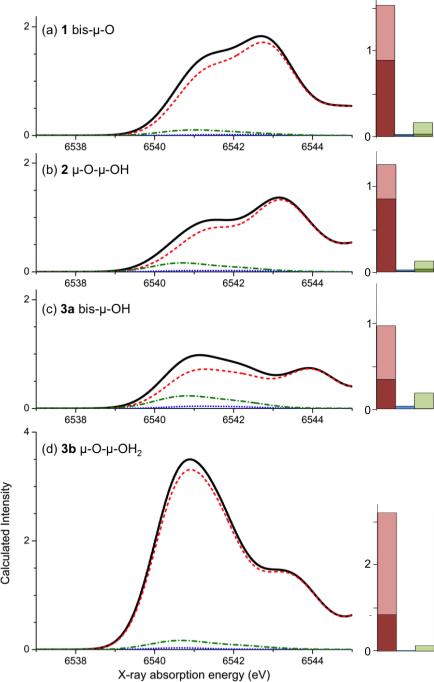
Figure 6.
Electric dipole (dash red), magnetic dipole (dotted blue) and electric quadrupole (dash-green) contributions to the total spectrum (black) from the mechanisms for compounds 1, 2, 3b, 3a panels a, b, c, d. Quantitatively, the contributions are presented as bar diagrams on the right. The total height of a column represents the total sum of calculated oscillator strength to the pre-edge from each of the mechanisms. The lighter shading represents the contribution from the first peak, and the darker shading the contribution from the second peak. Note that the intensity scale for 3b is twice as high as for the other complexes.

