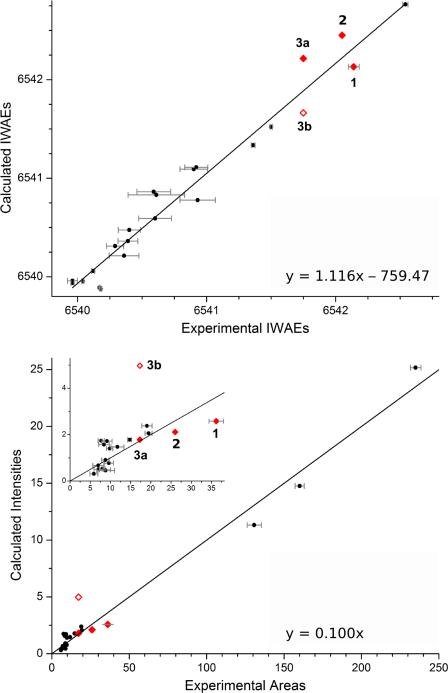
Figure 7.
Correlation of experimentally determined areas and high-spin calculated oscillator strengths (top) and IWAEs (bottom) for the whole pre-edge region (see Table 2), shown as red diamonds. Unfilled red diamonds correspond to values for structure 3b. Black circles correspond to the Mn monomer data previously reported, and referred to in the text. For more information on monomer data and error bars, see Table S3. The regression lines are based on the monomer data and follow y = 1.116 × – 759.47 (IWAEs, adjusted R = 0.979) and y = 0.100 × (areas, adjusted R = 0.994, forced through 0).

