Figure 6.
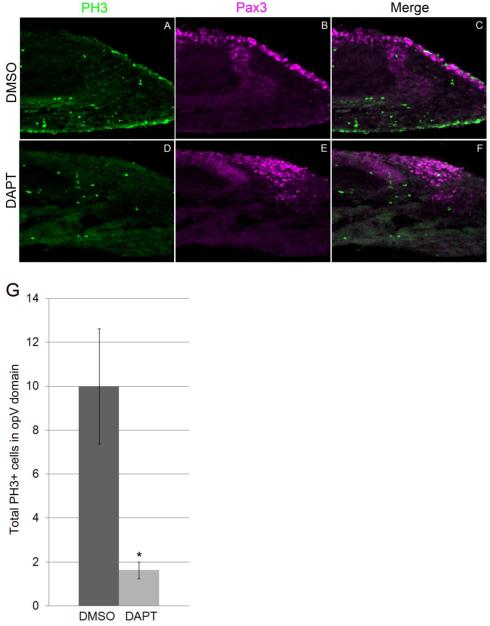
Notch inhibition results in decreased proliferation in the opV placode. Transverse section through the opV placode region of a 30-32 ss embryo. DMSO/DAPT head cultures were repeated, and immunostained for the mitotic marker Phosphohistone-3 (PH3; A,D) and Pax3 (B,E). DMSO treated embryos showed significantly more PH3+ cells in the opV domain (A-C) vs. DAPT treated embryos which showed significantly fewer PH3+ cells (D-F). Histogram describing total number PH3+ cells in the opV placode domain (G). Error bars depict SEM.

