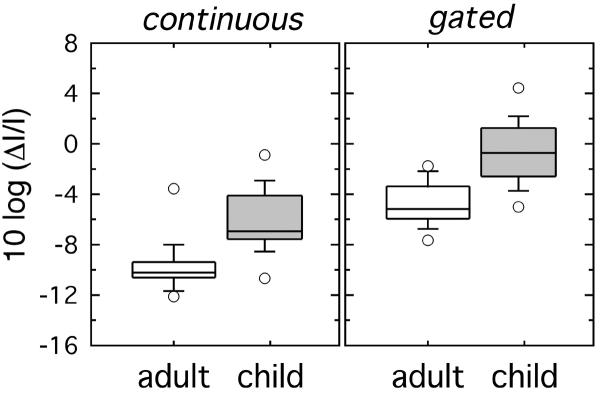
Figure 1.

The distributions of thresholds for increment detection with a continuous standard (left panel) and intensity discrimination with a gated presentation (right panel) are shown for children and adults. Horizontal lines indicate the median thresholds, boxes delineate the 25th – 75th percentiles, vertical lines indicate the 10th – 90th percentiles, and circles indicate the minimum and maximum thresholds.
