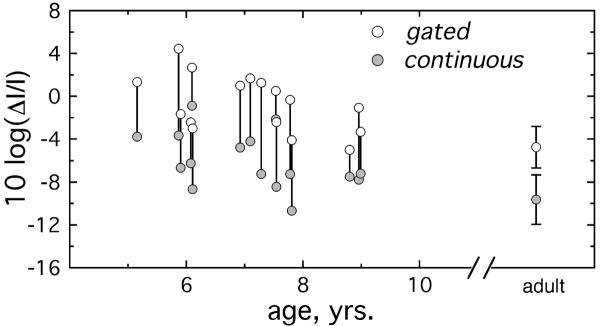
Figure 2.

Thresholds for individual listeners are plotted as a function of age for child listeners. Mean thresholds for adult listeners are indicated at the right of the figure, with error bars showing +/− 1 standard deviation. Thresholds for gated stimuli are plotted with open circles, and those for continuous stimuli are plotted with filled circles, as indicated in the legend.
