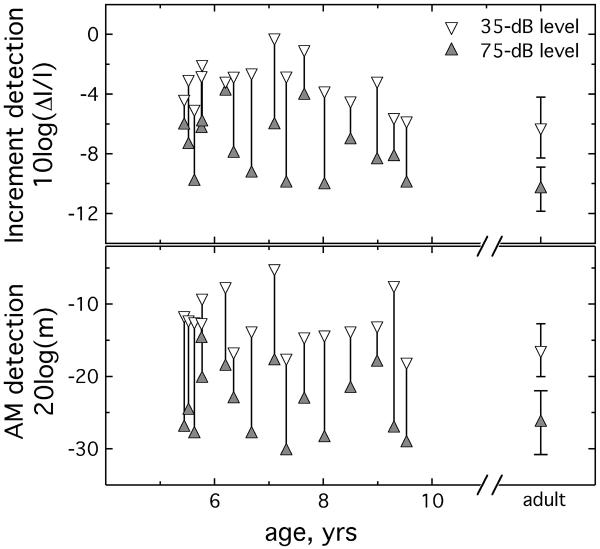
Figure 3.
Following the convention of Figure 2, threshold estimates are plotted for individual listeners as a function of age for child listeners. Mean thresholds for adult listeners are indicated at the right of the figure, with error bars showing +/− 1 standard deviation. The top panel shows results of the increment detection, and the bottom panel shows results of the AM detection task. Symbols indicate stimulus level, either 75 dB SPL (filled, up-pointing triangles) or 35 dB SPL (open, down-pointing triangles).

