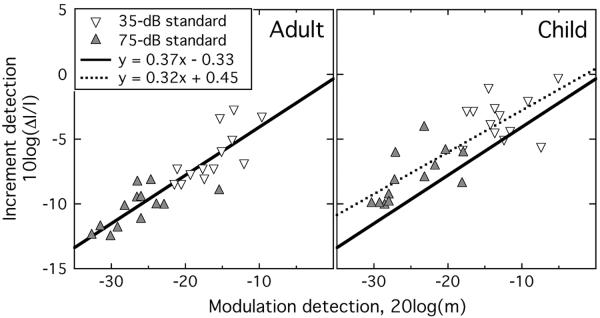
Figure 4.

Increment detection thresholds are plotted as a function of modulation detection thresholds for two signal levels. Symbols indicate stimulus level, which was either 75 dB SPL (filled, up-pointing triangles) or 35 dB SPL (open, down-pointing triangles). Adult data appear in the left panel, and child data appear in the right panel. The line fitted to adult data is indicated with solid lines in each panel. The best fit to child data is indicated in the right panel with a dotted line.
