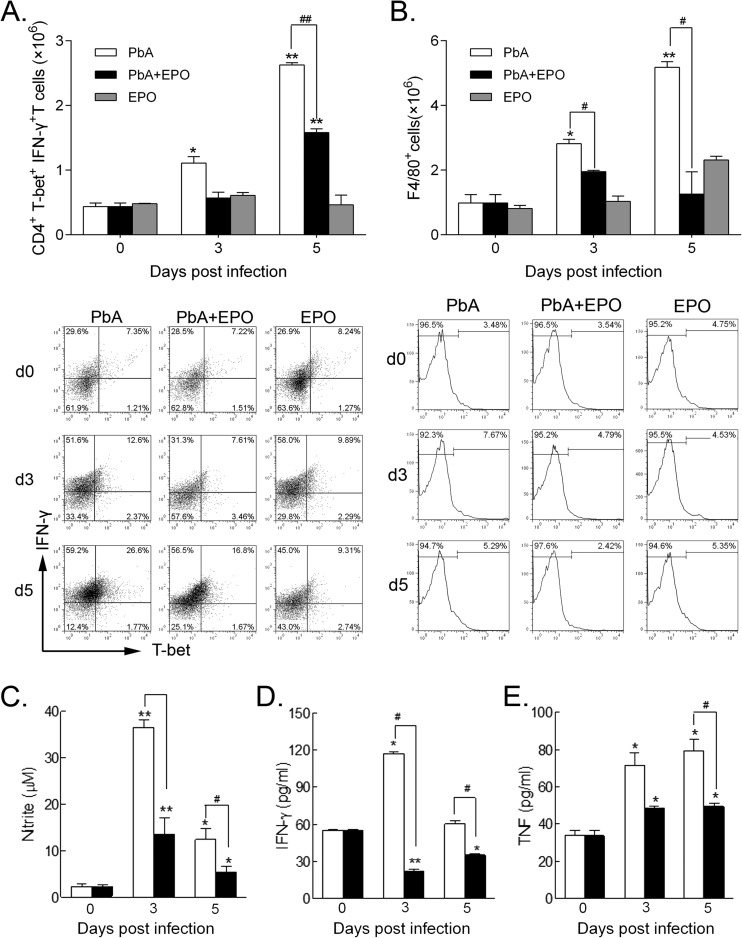
FIG 4.
Effects of rhEPO treatment on splenic Th1 cells, macrophages, and secretion of cytokines. (A) Absolute numbers (top) and proportion (bottom; representative dot plots) of CD4+ T-bet+ IFN-γ+ Th1 cells in spleens were quantified by flow cytometry. d, day. (B) Absolute numbers (top) and proportion (bottom; representative histograms) of macrophages (F4/80+ cells) in spleens were quantified by flow cytometry. (C to E) Splenocytes were cultured, and the supernatants were analyzed for concentrations of nitrite (C) and cytokines IFN-γ (D) and TNF (E). For each experiment, three mice were used per group. Each experiment was repeated three times. The values represent the means and SEM. * and **, significant differences compared with baseline levels on day 0 at P values of <0.05 and <0.01, respectively. # and ##, significant differences between P. berghei ANKA-infected and rhEPO-treated groups at P values of < 0.05 and <0.01, respectively.

