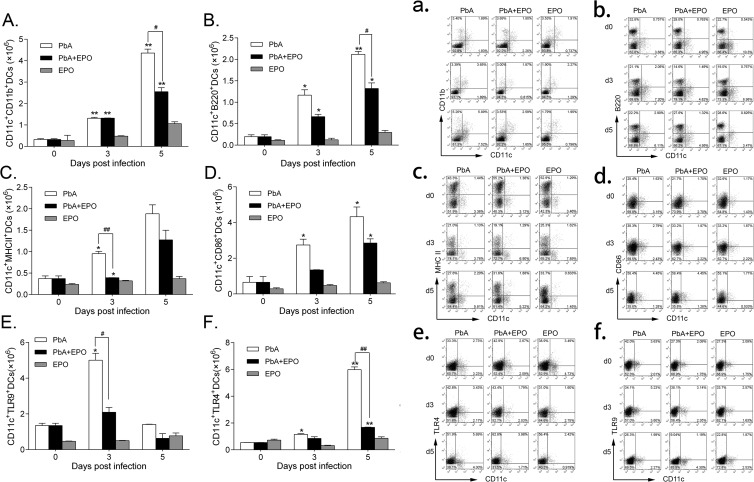
FIG 7.
rhEPO inhibits expansion of DC subsets and DC maturation and function. All DC subpopulations and markers were analyzed by flow cytometry. Shown are the absolute numbers (A) and proportion (a) of mDCs, absolute numbers (B) and proportion (b) of pDCs, absolute numbers (C) and proportion (c) of DCs expressing MHC-II, absolute numbers (D) and proportion (d) of DCs expressing costimulatory marker CD86, absolute numbers (E) and proportion (e) of DCs expressing intracellular TLR-9, and absolute numbers (F) and proportion (f) of DCs expressing TLR-4. The data are presented as means and SEM (n = 3). The results are representative of three independent experiments. * and **, significant differences compared with baseline levels on day 0 at P values of <0.05 and <0.01, respectively. # and ##, significant differences between P. berghei ANKA-infected and EPO-treated groups at P values of <0.05 and <0.01, respectively.

