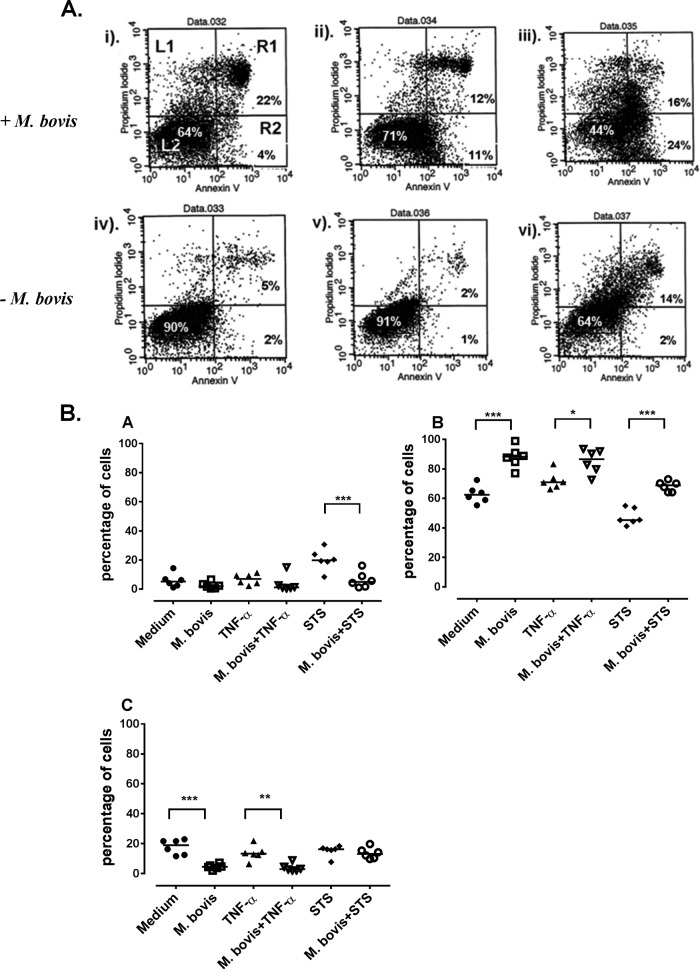
FIG 2.
Delay of apoptosis. (A) Representative dot plots showing apoptosis of CD14+ cells. Each well containing 5.0 × 10⁶ cells was untreated (i), treated with TNF-α for 24 h (ii), untreated for 18 h before addition of staurosporine for 6 h without M. bovis infection (− M. bovis) (iii), infected with M. bovis only (iv), infected with M. bovis and simultaneously treated with TNF-α (v), and infected with M. bovis with addition of 20 μM staurosporine 18 h later (vi). For all plots, the cell populations are gated into 4 quadrants representing cells that are undergoing necrosis (L1), alive (L2), undergoing early apoptosis (R2), or undergoing late apoptosis or death (R1). (B) Summary of the delay of monocyte apoptosis results (6 animals) after treatments. Medium, untreated cells; M. bovis, M. bovis-infected cells; TNF-α, cells treated with TNF-α; STS, cells treated with staurosporine; M. bovis + TNF-α, cells treated with TNF-α and infected with M. bovis; M. bovis + STS, cells infected with M. bovis and treated with STS. Shown are apoptotic cells stained with annexin V (A), live cells (B), and dead cells (C) (measured by propidium iodide uptake). The bars on the y axis show the median percentages of cells. Significant differences between treatments are indicated by ∗ (P ≤ 0.05), ∗∗ (P ≤ 0.01), and ∗∗∗ (P ≤ 0.001).

