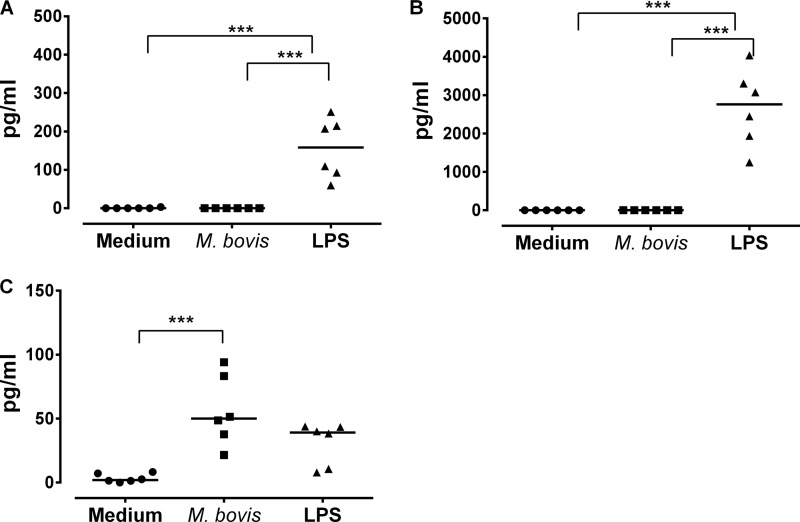
FIG 4.
Production of IFN-γ, TNF-α, and IL-10. The quantification of IFN-γ (A), TNF-α (B), and IL-10 (C) in supernatants from monocytes after 24 h of incubation with M. bovis is shown. Cytokines were quantified from undiluted supernatants. Each point represents the mean of triplicate wells for each animal, and the bar represents the median for all 6 animals for each cytokine. The treatment is indicated on the x axis. The left y axis shows IFN-γ and TNF-α levels in picograms/ml, and the right y axis shows the levels of IL-10 in units/ml. Significant differences in the levels of cytokines for each treatment are indicated by ∗∗∗ (P ≤ 0.001).

