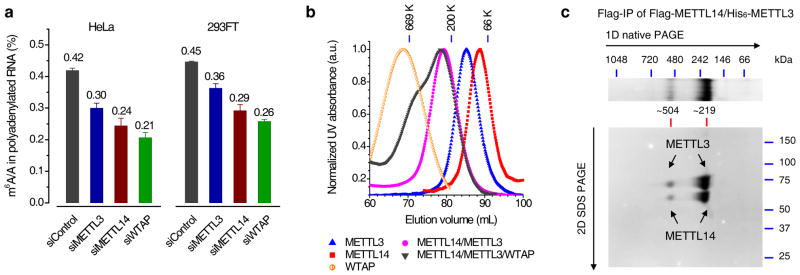
Figure 1. METTL3, METTL14, and WTAP affect the cellular m6A level in polyadenylated RNA with METTL3 and METTL14 forming a stable complex.

(a) LC-MS/MS quantification of the m6A/A ratio in polyadenylated RNA isolated from HeLa and 293FT with the control and single knockdown of METTL3, METTL14, or WTAP. Both groups of data were assessed using student’s t-test with P value < 1e-6 (calculated between control and specific knockdown sample). Error bars indicate mean ± s.d. (n = 10 for HeLa, five biological replicates × two technical replicates, and n = 8 for 293FT, four biological replicates × two technical replicates). (b) Gel filtration traces of individual Flag-tagged METTL3, METTL14, and WTAP, co-expressed Flag-METTL14/His6-METTL3 as well as mixed Flag-METTL14/Flag-METTL3/Flag-WTAP with equal molar amount. All proteins were expressed in insect cells and purified by Flag-IP. Markers: 669 kDa (thyroglobulin, bovine), 200 kDa (β-amylase from sweet potato), and 66 kDa (bovine serum albumin). (c) Coomassie staining of two-dimensional native/SDS PAGE of the Flag-IP product from insect cells co-expressing Flag-METTL14/His6-METTL3. The band of ~219 kDa corresponds to the METTL3-14 heterodimer, while the band of ~504 kDa represents dimer of dimer. Full images of gels are presented in Supplementary Fig. 15.
