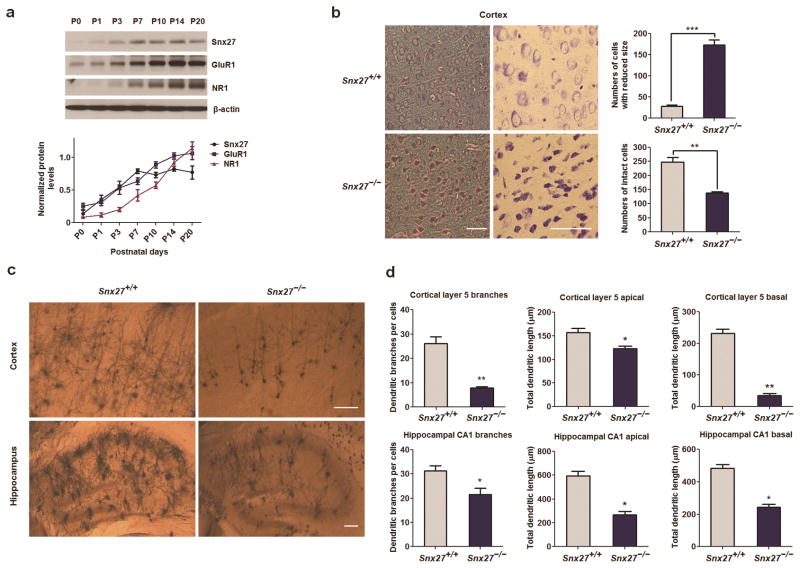
Figure 1. Neuropathology in the cortex and hippocampus of Snx27−/− mice.
(a) Expression pattern of Snx27, GluR1 and NR1 in the developmental mouse cerebrum. Brain lysates of C57Bl/6 mice at different postnatal days were analyzed by western blot to detect Snx27, GluR1, NR1 and β-actin (as loading control). Data represent mean ± s.e.m., n = 3.
(b) Decreased number and size of neurons in the cortex of Snx27−/− mice. Low (left panels) and high (right panels) magnification views of Nissl staining sections from Snx27+/+ (top panels) and Snx27−/− (bottom panels) mice (P14). Data represent mean ± s.e.m., n = 4. P values were calculated using two-tailed Student’s t test, *P < 0.05, **P < 0.01, ***P < 0.001. Bar=50μm.
(c,d) Decreased dendritic branches and lengths in cerebral cortex and hippocampus in Snx27−/− mice. Golgi staining of cortex (upper panels) and hippocampus (lower panels) of Snx27+/+ (left panels) and Snx27−/− (right panels) mice (P14) are presented in (c).
Quantitative analysis of apical and basal dendrites and total branch points in cortical layer 5 pyramidal and hippocampal neurons in Snx27+/+ and Snx27−/− mice are shown in (d). Data represent mean ± s.e.m., n = 4. P values were calculated using two-tailed Student’s t test, *P < 0.05, **P < 0.01, ***P < 0.001. Bar=100μm.

