
Figure 1.
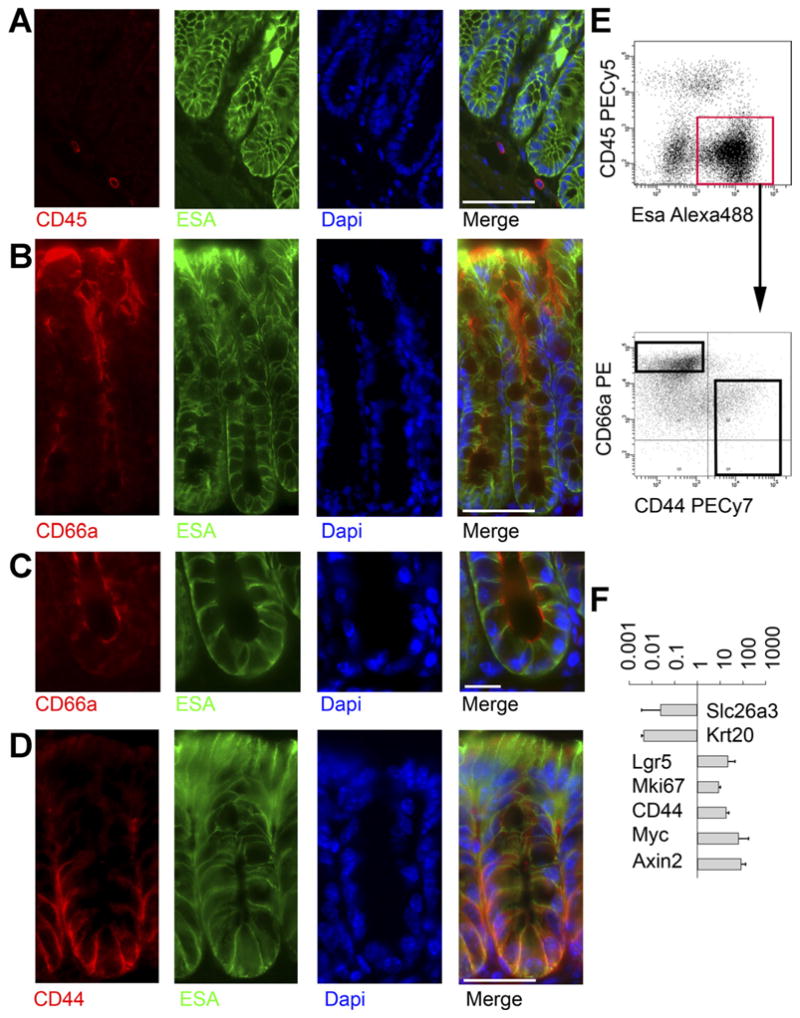
Prospective FACS separation of colonic crypt subregions. (A) Mouse colon stained for CD45 (red), ESA(green), and 4′,6-diamidino-2-phenylindole (DAPI) (blue) shows that CD45 and ESA stain distinct cells. Scale bar: 50 uM. (B) Staining for CD66a (red), ESA/EpCAM (green), and DAPI (blue) shows a gradient of colonic CD66a expression, with the strongest staining on apical membranes near the lumen. Scale bar: 50 uM. (C) Higher magnification view of crypt base stained for CD66a (red), ESA green), and DAPI (blue) shows CD66a is present at the crypt base. Scale bar: 25 uM. (D) Staining for CD44 (red), ESA green), and DAPI (blue) shows a gradient of CD44, with the strongest staining at the crypt base along basolateral membranes. Scale bar: 50 uM. (E) FACS plot of ESA vs CD45 enables gating on epithelial cells (red box), which are then plotted for CD44 vs CD66a, showing the gradients predicted by immunofluorescence. (F) After sorting cells from the black boxes in (E), RNA was isolated for gene expression analysis. Relative expression (CD44+CD66alow/neg/CD44− CD66ahigh) of genes known to mark the crypt top or bottom is shown. Data are expressed as mean fold-change ± standard deviation. n = 3.