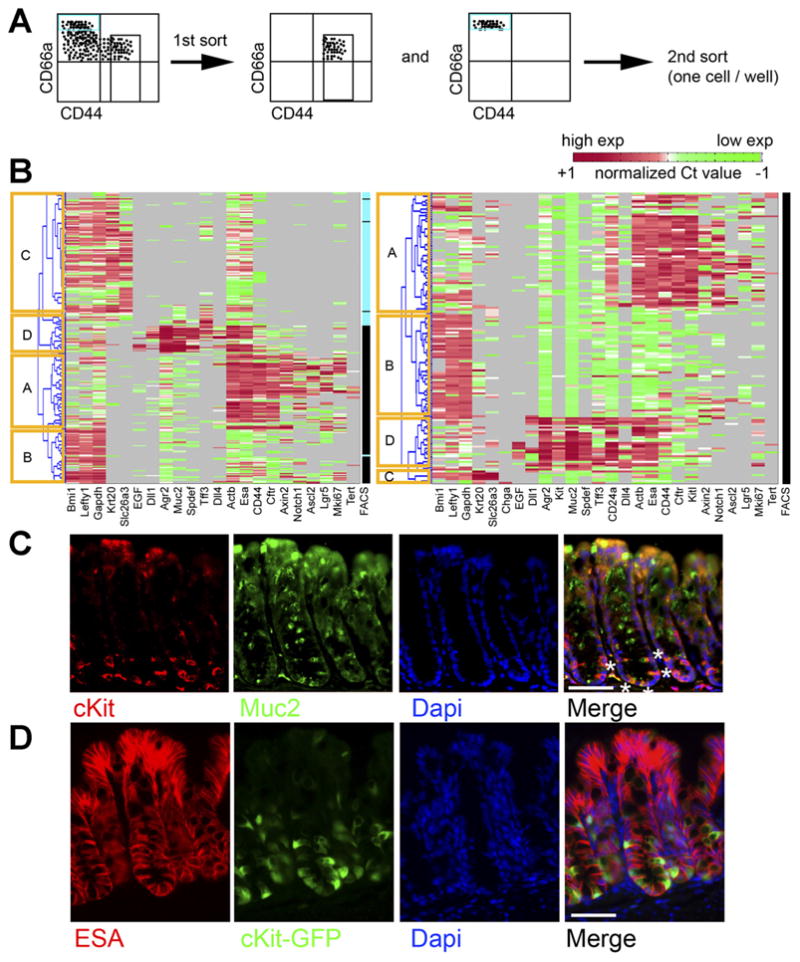
Figure 2.

Single-cell gene expression analysis of sorted colonic crypt subregions reveals distinct transcriptional states. (A) Experimental schema. Crypt base (Esa+CD45−CD44+CD66alow/neg) and crypt top (Esa+CD45− CD44−CD66ahigh) FACS-sorted colonic cells were sorted as shown. (B) Each row indicates a single cell, and each column indicates a gene. Red indicates high expression (normalized Ct < mean), green indicates low expression (normalized Ct > mean). Gray indicates no expression. Columns labeled “FACS” indicate sorted phenotype (black, CD44+ CD66alow/neg; blue, CD44− CD66ahigh). Hierarchical clustering reveals distinct clusters, labeled as (A–D)(yellow boxes). Two separate experiments are shown. (C) Staining colon for cKit (red) and Muc2 (green) and 4′,6-diamidino-2-phenylindole (DAPI) (blue) shows a subset of Muc2+ cells at the crypt base are cKit+. White asterisks on one crypt highlight this in the merge panel. (D) Staining colon from cKit-GFP reporter mice with Esa (red) and DAPI (blue) shows GFP+(green) epithelial cells. Scale bars: 50 uM.
