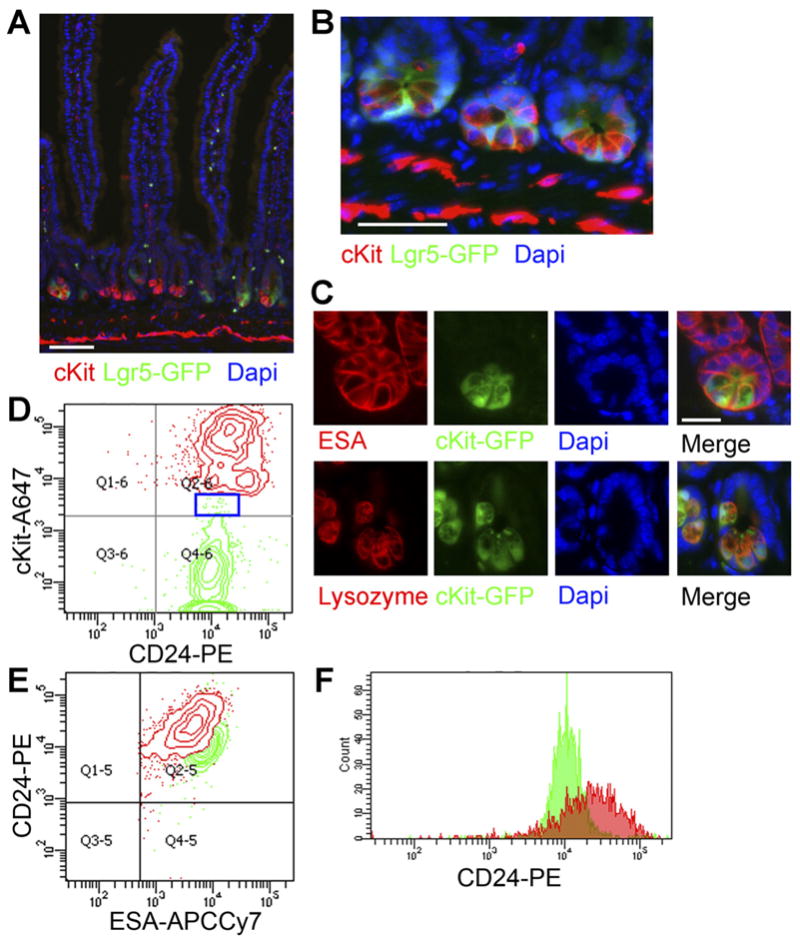
Figure 3.

cKit/CD117 marks Paneth cells. (A) Low and (B) high magnification views of Lgr5GFP small-intestine shows cKit expression (red) in Paneth cells interspersed between Lgr5+ cells (green). Nuclei are stained with 4′,6-diamidino-2-phenylindole (DAPI) (blue). Stromal cKit immunoreactivity is also seen. Scale bars: 50 uM. (C) Small-intestinal crypts from cKit-GFP reporter mice stained for Esa (red, top row) or Lysozyme (red, bottom row) and 4′,6-di-amidino-2-phenylindole (DAPI) (blue) show Paneth cell (green) signal. Scale bar: 25 uM. (D) A FACS plot of Lgr5GFP+ cells (ESA+CD45−Lgr5GFP+, green, 2.9% of epithelial cells) and cKit+ cells (ESA+CD45−cKit+, red, 2.4% of epithelial cells) reinforces that the populations are distinct and CD24+. Blue box shows rare Lgr5GFP+cKit+ cells. (E) A plot of the same cells from (C) shows that the cKit+ cells have higher CD24 mean fluorescence. (F) A histogram of CD24 further demonstrates that cKit+ epithelial cells (red) exhibit higher CD24 mean fluorescence than Lgr5GFP cells (green).
