Figure 6.

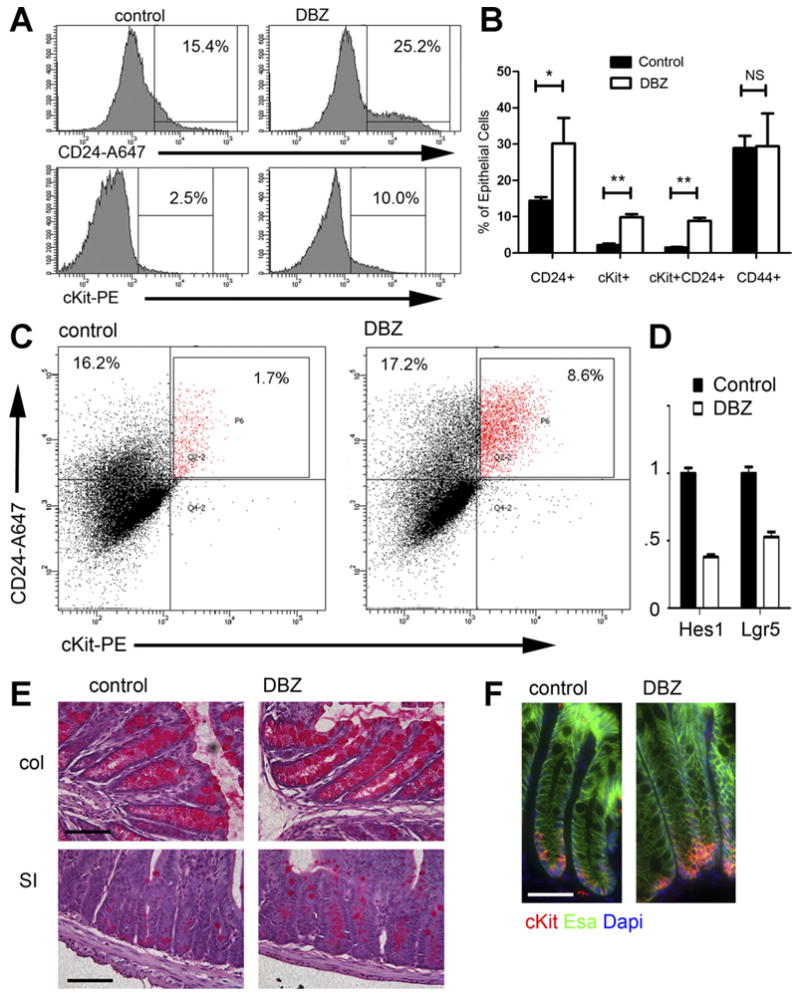
Blocking Notch signaling increases cKit+ cells. (A) FACS histograms of epithelial (Esa+CD45−) cells from representative control and DBZ-treated mice show an increase in CD24 and cKit. (B) The percent of epithelial (Esa+CD45−) cells staining for different surface markers (x-axis) in control and DBZ-treated mice is plotted, showing an increase in cKit+ cells, CD24+ cells, and cKit+CD24+ cells. No increase in CD44+ cells was seen. n = 4 per group. *P < .005; **P < .001; NS, not significant, P > .05. (C) FACS plot of CD24 vs cKit for epithelial cells from representative control and DBZ-treated mice illustrates the large increase in CD24+cKit+ epithelial cells. (D) qRT-PCR on RNA isolated from control and DBZ colon showed the expected decrease in Lgr5 and Hes1. n = 4 samples per group. P < .05. (E) Periodic acid-Schiff stains of colon (top) and small intestine (bottom) from representative control and DBZ mice shows hyperplasia of mucin-containing secretory cells with DBZ treatment. (F) Immunostaining of control and DBZ-treated colon for cKit (red), Esa (green), and 4′,6-diamidino-2-phenylindole (DAPI) (blue) shows an increase in crypt base cKit+ cells. Scale bars in (E, F): 50 uM.
