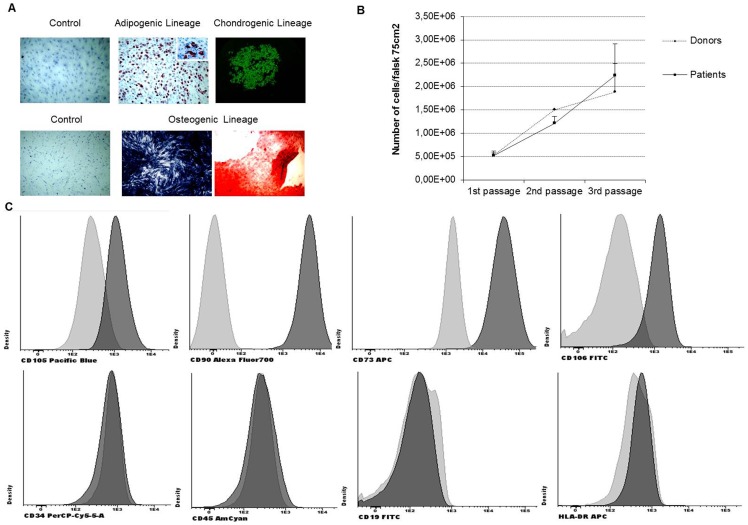
Figure 1. Characterization of MSC.
(A) In vitro differentiation potential of MSC. In vitro adipogenic differentiation. Representative images show the light microscopic view of lipid drop accumulation after 3 weeks of culture in control medium and in differentiation induction medium. In vitro chondrogenic potential of MSC. Representative images show the light microscopic view of alkaline phosphatase activity (detected by a blue-dark staining) and mineralization after culture in control medium and in differentiation induction medium (detected by red staining). (B) Growth rate evaluation in MSC-HD and MSC-P. Cells were counted with trypan blue at each passage. Trypan blue selectively colors dead cell in blue whereas live cells are observed shinning since this marker is unable to enter the cytoplasm when the cell membrane in intact. Both sets of samples presented similar growth rates and were in continuous growth during these experiments. (C) Immunophenotypic characterization of MSC: positive expression of CD105, CD90, CD73 and CD106 and negative expression of hematopoietic markers CD34, CD45, CD19 and HLA-DR (light gray represents control and darker gray represents sample with antibody).

