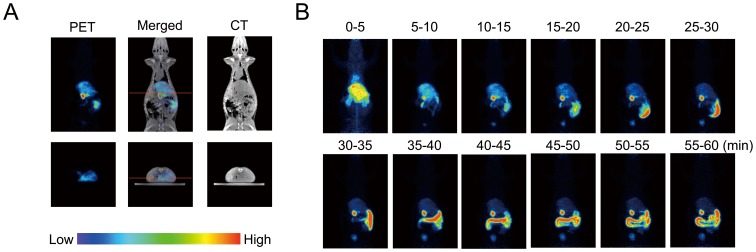
Figure 5. PET imaging of biodistribution of [11C]Me-EGCG after intravenous injection.
Biodistribution of [11C]Me-EGCG was determined with a small-animal PET system (Clairvivo PET). [11C]Me-EGCG solution was intravenously injected to a Wistar rat via a tail vein, and PET scanning was started immediately after the injection. (A) Photographs indicate horizontal (upper panel) and vertical (lower panel) images obtained from the data accumulated during 10–15 min. (B) The data were acquired for 60 min and integrated every 5 min.

