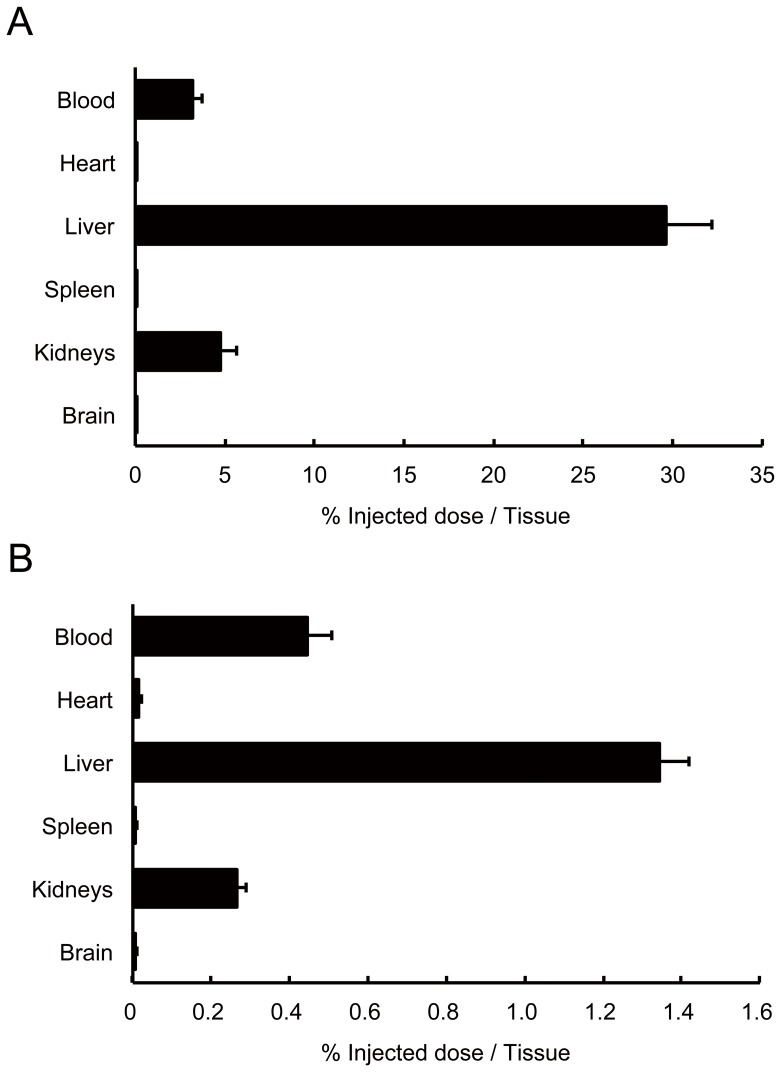
Figure 6. Biodistribution of [11C]Me-EGCG after intravenous injection.
[11C]Me-EGCG solution was intravenously injected into Wistar rats (n = 4) via a tail vein, and the accumulation of 11C in each organ at 5 min (A) and 60 min (B) after the injection was measured by using a γ-counter. Data are presented as the percent of the injected dose per whole tissue and S.D.

