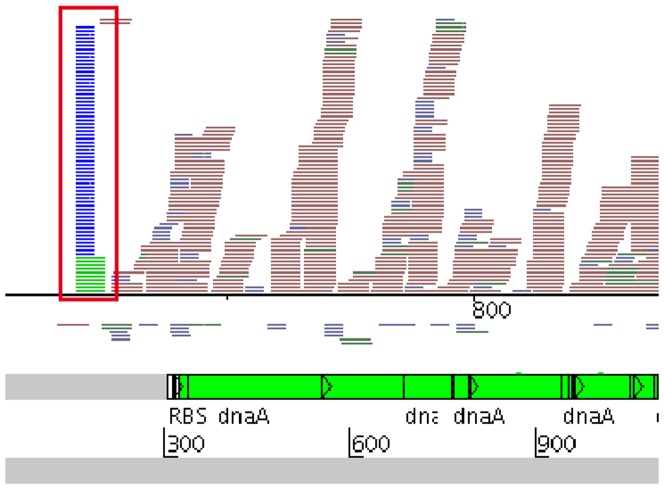
Figure 2. Pileup of reads representing the TSS of the dnaA gene of L. monocytogenes.
Reads are mapped onto the L. monocytogenes genome and depicted as horizontal lines in the top half of the figure. Forward reads are mapped above, reverse reads below the base line. Blue reads are from the sample containing RNA fragments <40 nt, green reads from the sample containing RNA between 40 nt and 150 nt, red reads from the fraction containing RNA >150 nt. The lower half of the figure shows the corresponding annotation at this genome location, with the beginning of the dnaA gene at position 318. Artemis [39] was used to illustrate the mapped reads and annotation of the genome.

