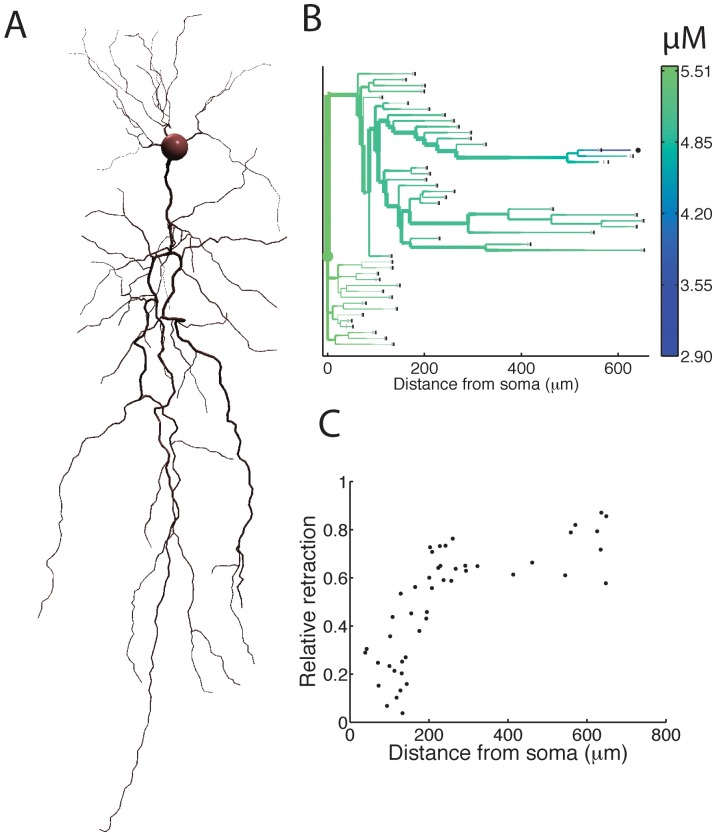
Figure 3. Competition between neurite branches in a complex morphology.
(A) Example morphology of a reconstructed pyramidal neuron with apical and basal dendrites. (B) In the control case, starting from the reconstructed morphology, the neuron was allowed to grow out for 10 hours in the model. The simulation was then repeated with the same initial conditions, but with increased polymerization rate for one of the growth cones. The dendritic morphology obtained in this last simulation is represented by a dendrogram, colored according to the tubulin concentration in the branches. The gray vertical lines at the terminal segments indicate the starting morphology, and the black vertical lines show the neurite length after 10 hours in the control case. The black dot marks the growth cone with increased polymerization rate. (C) The competition between branches increases with increasing path distance to the soma. The graph shows the total retraction of all neurites, divided by the growth of the modified growth cone, as a function of path length between the modified growth cone and the soma.

