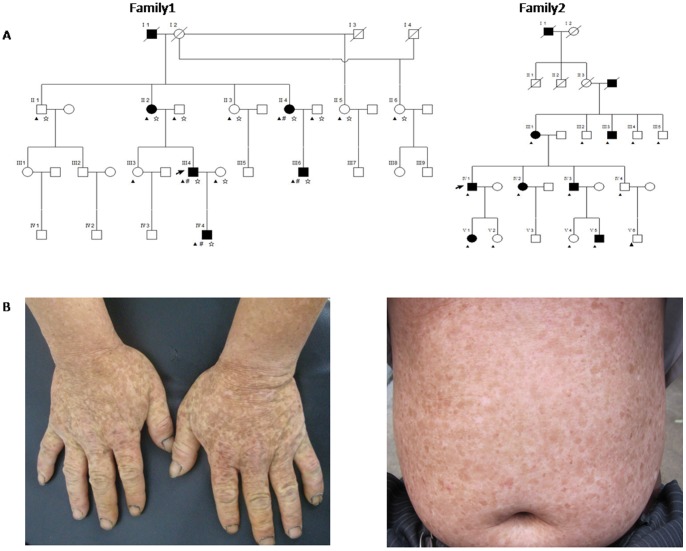
Figure 1. Family trees and clinical manifestations.
A Shown are the pedigree of family 1 and 2 with autosomal dominant DUH. “#”represents the individuals used in exome sequencing analysis, “☆”represents the individuals used in the linkage analysis; “▴”represents the individuals subjected to Sanger sequencing analysis. B: Clinical manifestations of DUH patients, both hands and abdomen with hyper- and hypo-pigmented macules in variable distribution and patterns.

