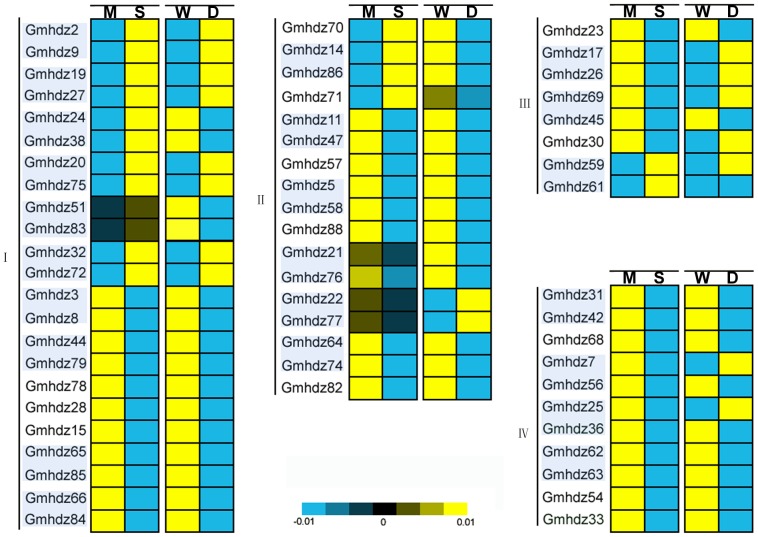
Figure 4. Differential expression of soybean HD-Zip genes under salinity and drought stress.
Expression is indicated as fold-change of experimental treatments relative to control samples and visualized in heatmaps. Color scale represents log2 expression values, with yellow representing low levels and blue indicating high levels of transcript abundance. To increase the contrast in this figure, the color scale values were reduced. The heatmap shows hierarchical clustering of 59 genes under salinity and drought stress. The pairs with light blue background are paralogous genes. Microarray data (under accession numbers GSE40627 and GSE41125) were obtained from the NCBI GEO database. M, mock; S, salinity stress; W, well-watered; D, drought stress. The paralogous pairs are indicated with a light blue background.

