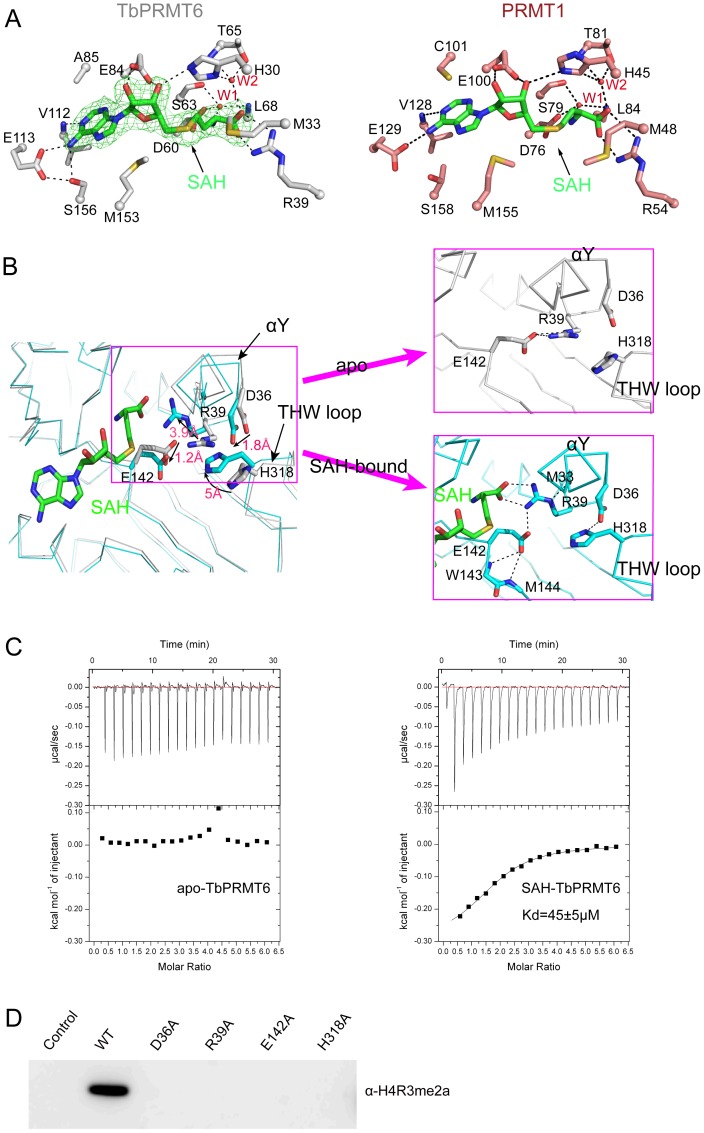
Figure 2. SAH recognition.
(A) SAH interaction with TbPRMT6 (left) and rat PRMT1 (right) The residues are shown in the stick model and labeled, and the water molecules are shown as red spheres and labeled with W1 and W2 A representative omit (Fo-Fc) electron density map (green) shows the bound SAH The dashed lines represent hydrogen bonds (B) The conformational change in the active site of TbPRMT6 induced by SAH binding The left figure is the superposition of the apo (grey) and SAH-bound (cyan) structures of TbPRMT6 The movements of the key residues are highlighted by arrows and distances The right figures are enlarged views of the active site of TbPRMT6 in the free and SAH-bound states The dashed lines represent hydrogen bonds (C) ITC-based measurements of the bindings of AcH4-21 to apo and SAH-bound TbPRMT6 The fitted Kd of AcH4-21 to SAH-bound TbPRMT6, including the standard errors in the measurements, are indicated in the panel (D) Enzymatic assays of TbPRMT6 mutants with mutations in the residues that undergo significant rearrangement upon SAH binding.

