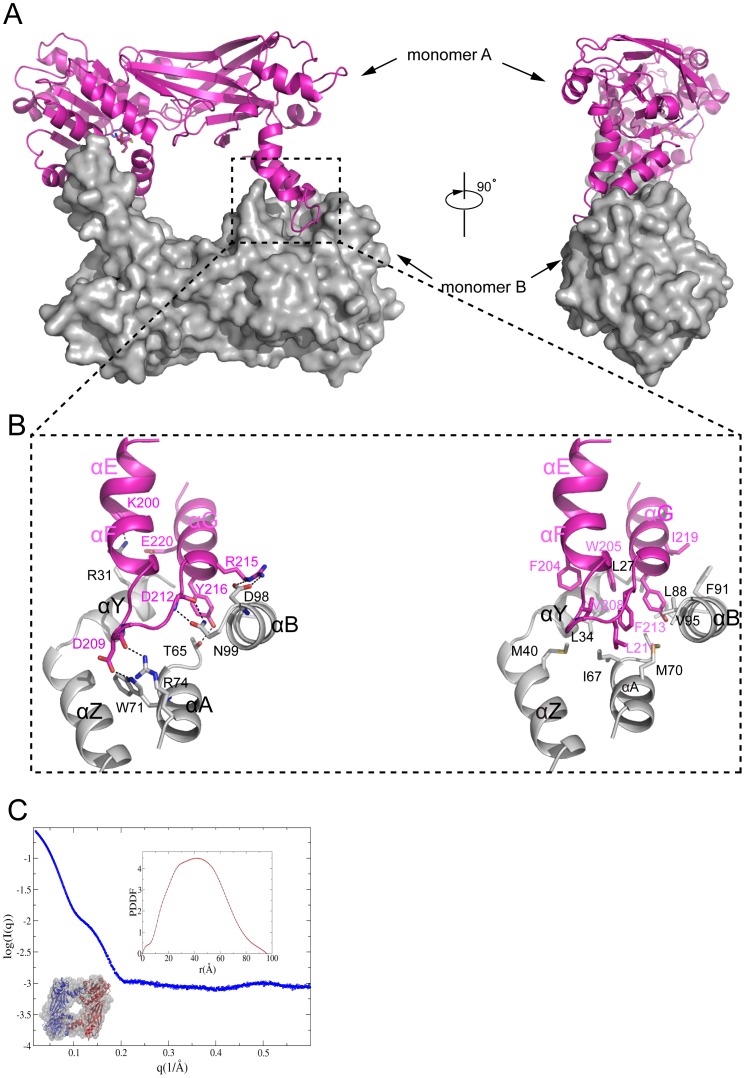
Figure 4. Dimerization of TbPRMT6.
(A) Two views of the TbPRMT6 dimer Monomer A is shown as a cartoon colored in magenta, and monomer B is colored in gray and shown through a surface presentation (B) Dimerization interactions The left image represents the hydrogen bond interactions on the dimeric interface, and the right image represents the hydrophobic interactions (C) SAXS results of TbPRMT6L The experimental SAXS curve of TbPRMT6 and the data points up to q = 06 Å−1 are plotted The top-right inset is the PDDF calculated by GNOM, and the bottom-left inset is the DR model with the crystal structure superimposed with a TbPRMT6 dimer The Rg and Dmax of TbPRMT6 are 328±01 Å and 959 Å, respectively The DR models were generated by GASBOR using the final χ against the raw SAXS data of 063 The X-ray structure of the TbPRMT6 dimer can be superimposed onto the DR models quite well, with an NSD of 109.

