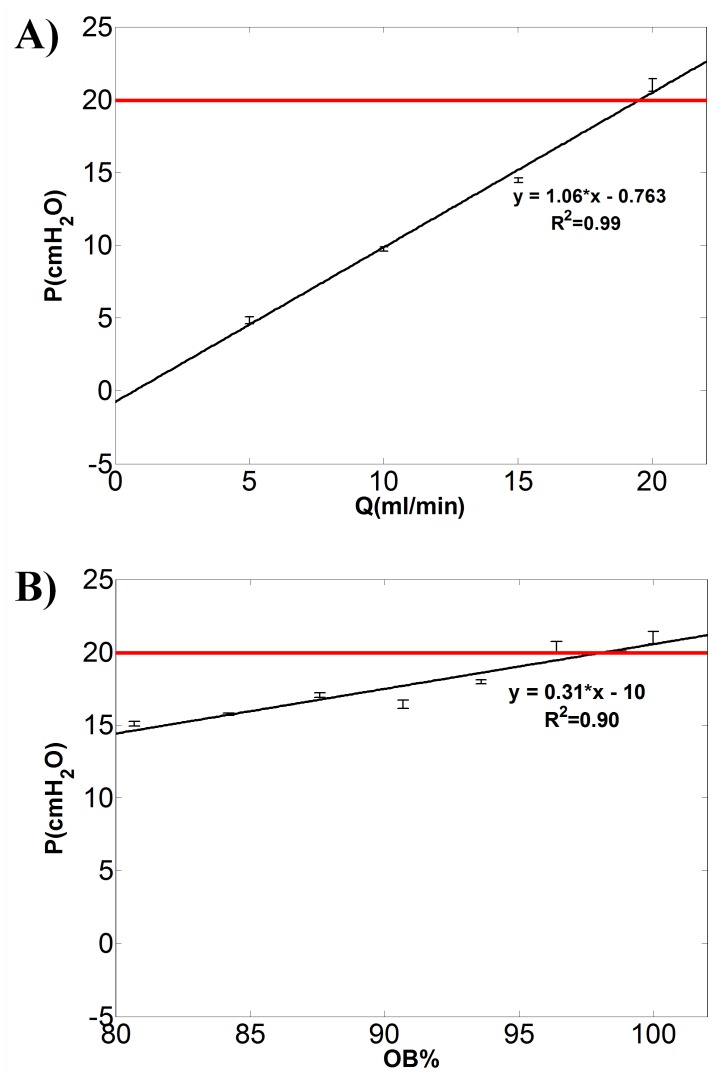
Figure 5. Renal pelvic pressure vs urine properties and severity of obstruction.
Renal pelvic pressure (P) in the ureteric model increases linearly with A) flow rate (Q in ml/min) and B) severity of obstruction in the upper UM (OB%, calculated using Eq. 1). Fixed values of OB% = 100 and Q = 20 ml/min were considered for the experimental data reported in A) and B), respectively. The fluid dynamic viscosity is equal to 1 cP. The equation of the least square regression line, the R-squared values and error bars are reported (N = 3). The slope of regression line in panel A represents the hydraulic resistance of the system. The horizontal red line indicates the critical value of renal pelvic pressure (P = 20 cmH2O).

