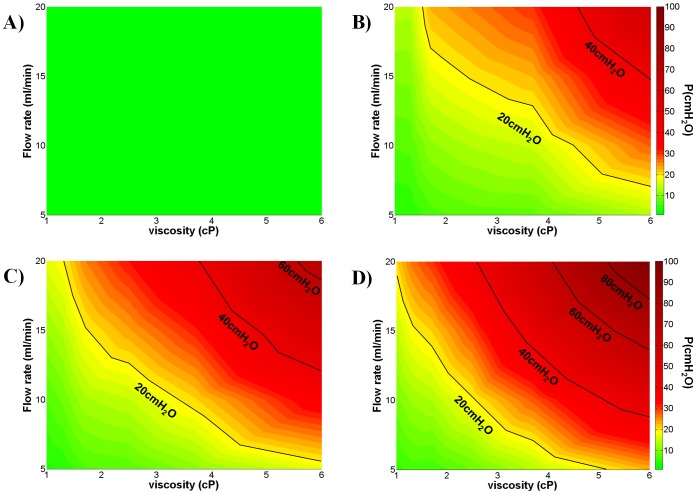
Figure 6. Dependence of UM renal pelvic pressure on fluid flow rate, dynamic viscosity and severity of obstruction.
Colourmaps show the dependence of ureteric model (UM) renal pelvic pressure on both the fluid flow rate (Q in ml/min, y-axis) and the fluid dynamic viscosity (μ in cP, x-axis). Colours correspond to different pressure values (in cmH2O) reported in the colourbar on the right hand side. A) OB% = 0, corresponding to unobstructed UM (absence of both plastic sphere and stent). B) refers to the condition of obstruction-causing effects, due to the stent only (absence of plastic sphere). Adding the plastic sphere, two values of severity of obstruction were considered: C) OB% = 88 and D) OB% = 100 (stent+plastic sphere, with hole size according to Eq. 1). Iso-pressure lines (in cmH2O) are reported (black lines). The green area corresponds to the safe region (P<15 cmH2O), the yellow area to the warning region (15<P<20 cmH2O) while the orange/red area to the dangerous region (P>20 cmH2O) for correct kidney functioning. N = 3.

