
Figure 2. Mean development rate for larval stages (A) and from hatch to emergence across diet treatments.
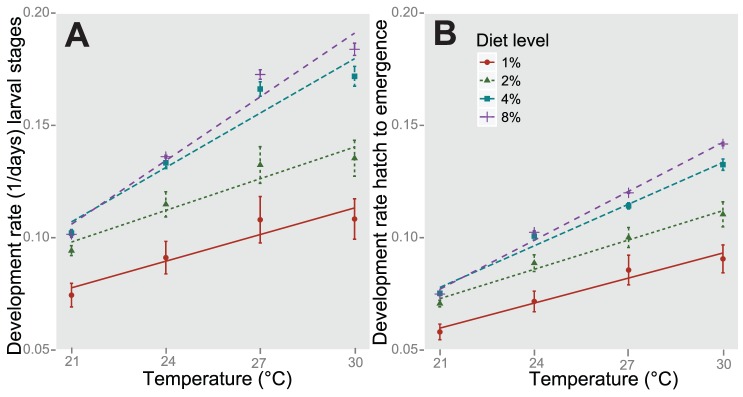
The amounts of each diet (mg/ml) were added to experimental cups daily. Bars indicate standard error. Character shape, color, and line type indicate diet treatment. Lines indicate simple linear regression for diet treatments.