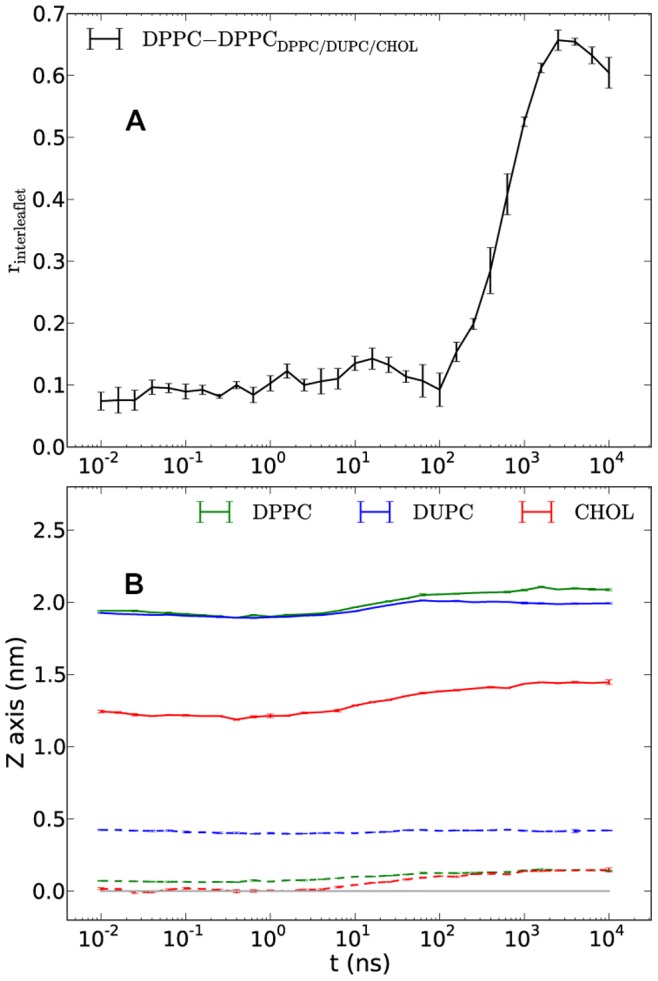
Figure 9. Interleaflet domain correlation coefficient and temporal z coordinates of lipid/CHOL heads and tails.

Interleaflet DPPC-domain correlation coefficient (A) and temporal z coordinates of heads and tails of lipids and CHOL relative to the bilayer center for the DPPC/DUPC/CHOL system (B). The relative coordinates of heads and tails in (B) are shown in solid and dashed lines, respectively. The horizontal gray line at 0.0 shows the bilayer center. The error bars present the standard errors from averaging over five independent runs.
