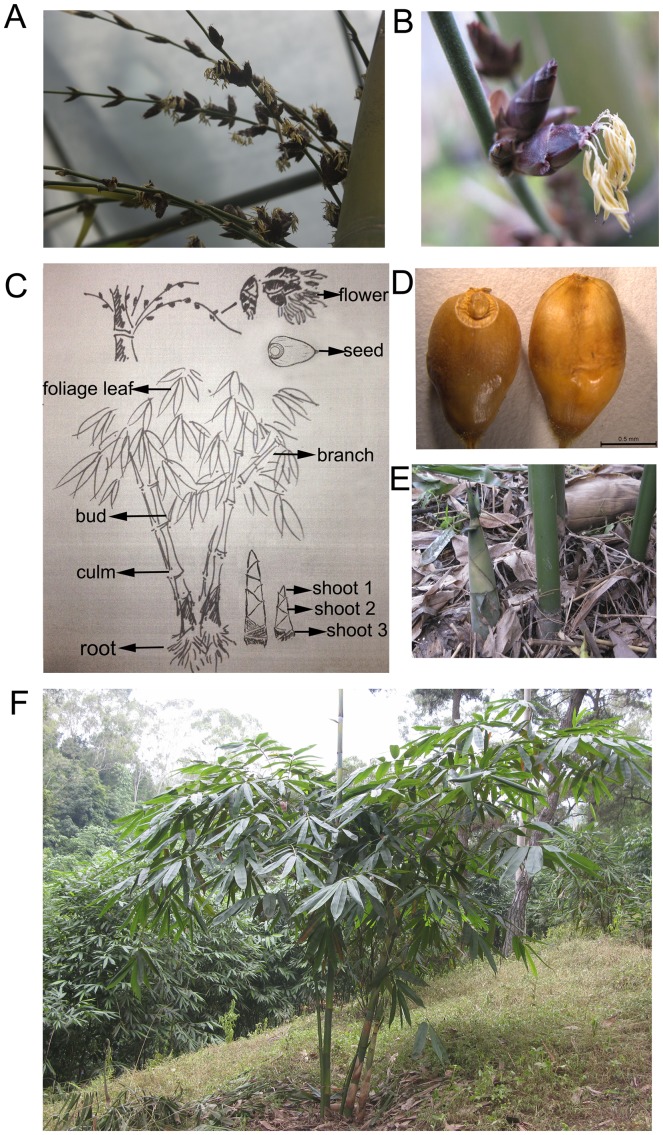
Figure 1. Schematic diagram illustrating different tissue origins used for qRT-PCR and photos represent specific tissues.
(A) and (B) represent the close up of D. latiflorus Munro flowers. (C) Schematic diagram illustrating different tissues origin used for qRT-PCR. (D) and (E) represent D. latiflorus Munro seeds and shoots. (F) Growth behavior of D. latiflorus Munro.

