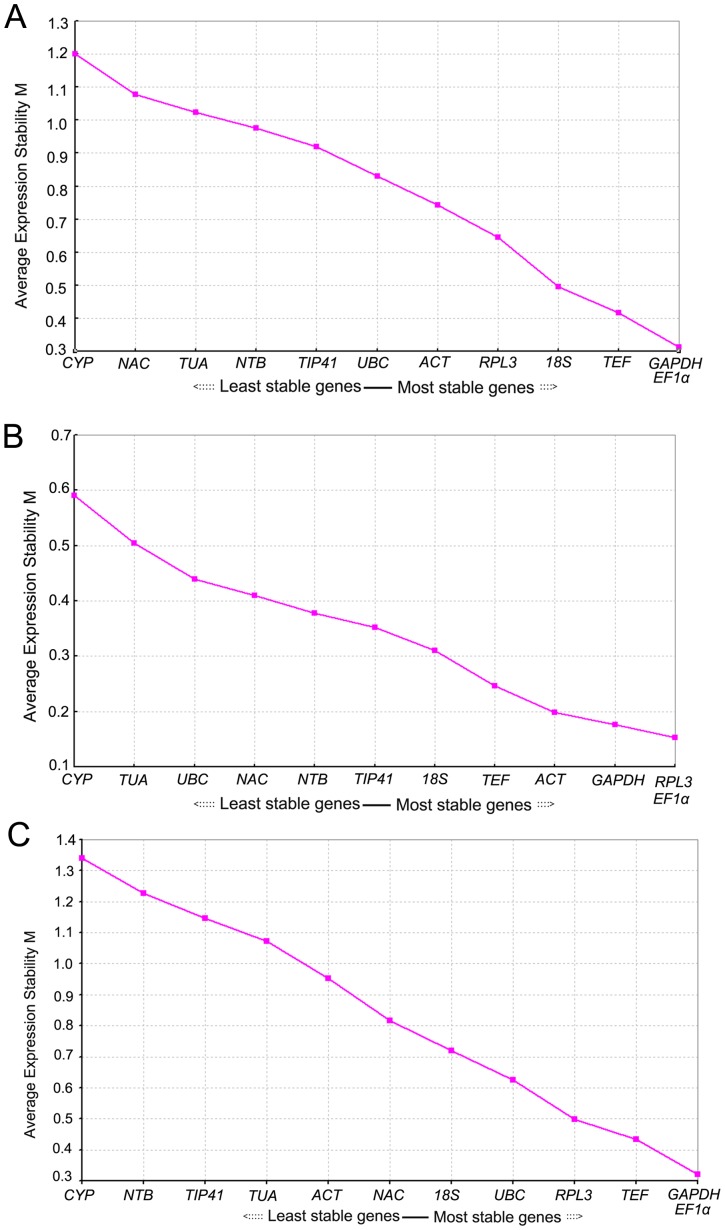
Figure 4. Gene expression stability of the twelve candidate genes of D. latiflorus Munro as predicted by geNorm.
(A) Different tissues, (B) Different samples from seedlings and anther-regenerated plants of different ploidy, (C) All samples. Lower average expression stability (M value) indicates more stable expression. The least stable genes are on the left, and the most stable on the right.

