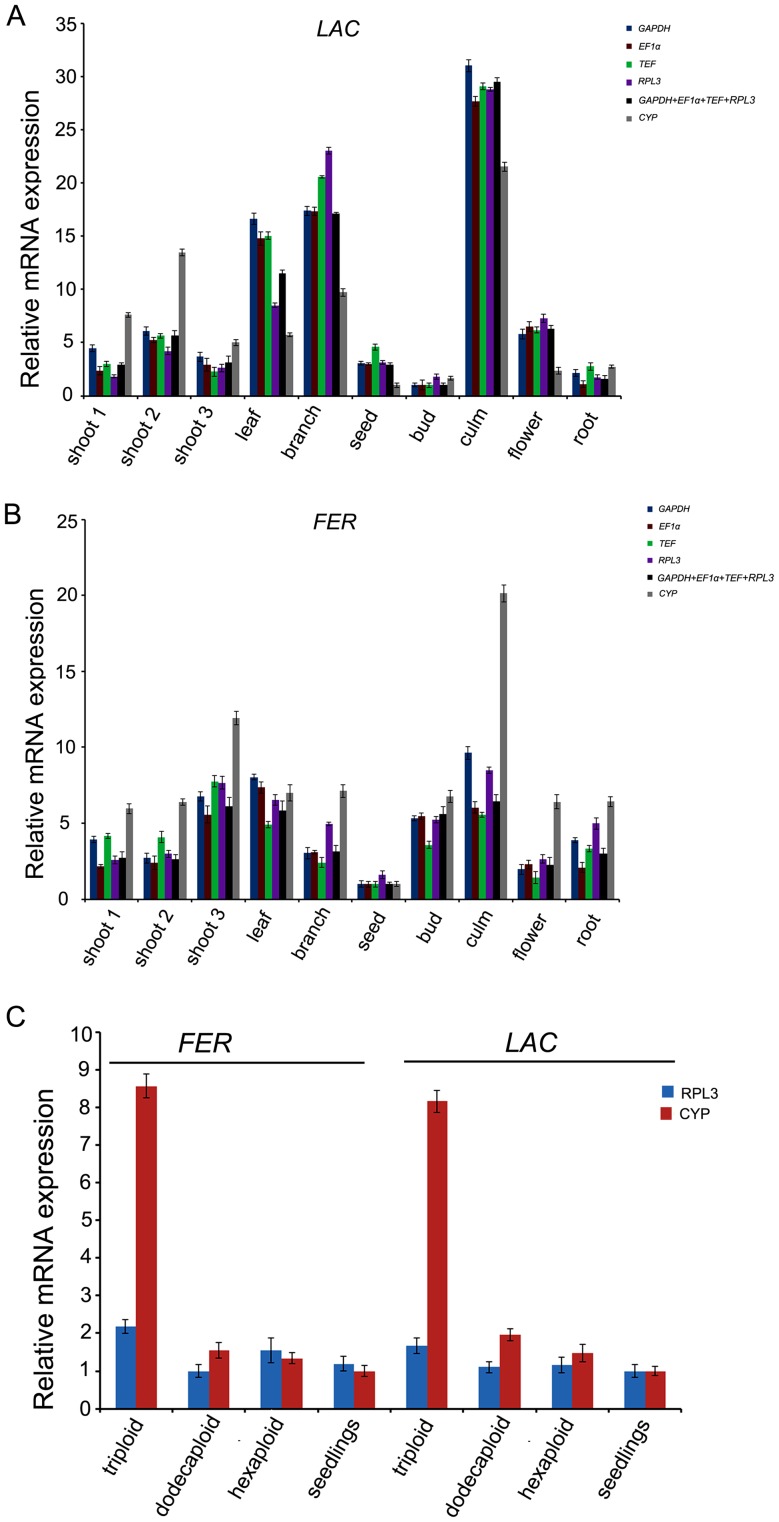
Figure 6. Relative quantification of two target gene expression using identified reference genes for normalization.
(A) The expression profile of laccase across different tissues of D. latiflorus Munro. (B) The expression profile of ferritin across different tissues of D. latiflorus Munro. (C) The expression profiles of ferritin and laccase among samples from seedlings and anther-regenerated plants of different ploidy. Genes were normalized to individual and/or combined reference genes. Error bars show the standard error calculated from three biological replicates.

