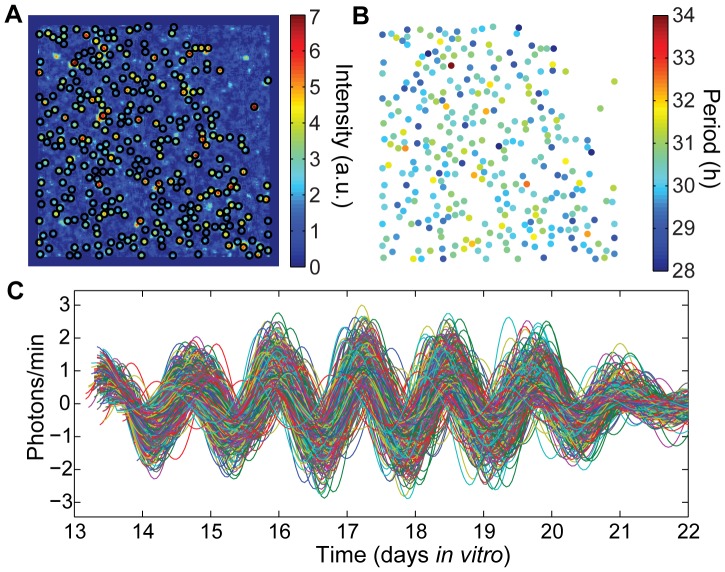
Figure 5. Single cell rhythms in mixed cultures.
A) The intensity of bioluminescence of the field of view captured by the CCD camera over days in vitro, as described in the Methods, which was used to determine locations of 313 ROIs in a hepatocyte collagen gel sandwich culture consisting of 25% Cry2−/− Per2Luc hepatocytes and 75% WT (non-bioluminescent) cells. B) Periods of the rhythmic ROIs (mean AWT estimate during DIV 14–16) with mean 30.2 h and standard deviation 0.8 h. C) PER2::LUC bioluminescence traces for the rhythmic ROIs, with trend and noise removed by discrete wavelet transform.

