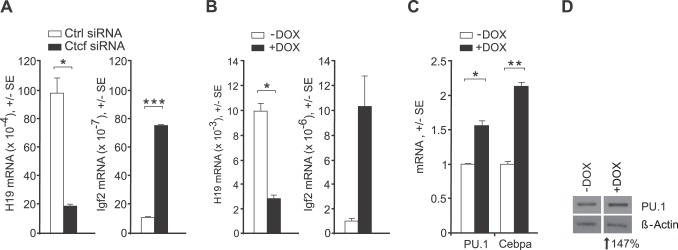
Figure 3. Smarca5 regulates Ctcf target genes.

A: H19 and Igf2 mRNA expression upon Ctcf knockdown (Ctcf siRNA) or Ctrl siRNA. B: Smarca5 knockdown (+DOX) compared to untreatment (-DOX). RT-PCR analyses (A&B) were done at 72hrs. Y-axis: specific mRNAs relative to Hprt1 levels. C: mRNA levels of PU.1 and Cebpa at 96 hrs (4 days) upon Smarca5 knockdown. Y-axis: specific mRNA relative to average of Hprt1 and Gapdh was normalized on negative control (non-specific siRNA). Error bars: the standard errors (SE). Asterisks: p-values (t-test, 0.05–0.005). D: PU.1 and β-actin expression determined by Immunoblotting at 144 hrs (6 days) upon Smarca5 knockdown. Level of downregulation (bellow blots) was determined by densitometry.
