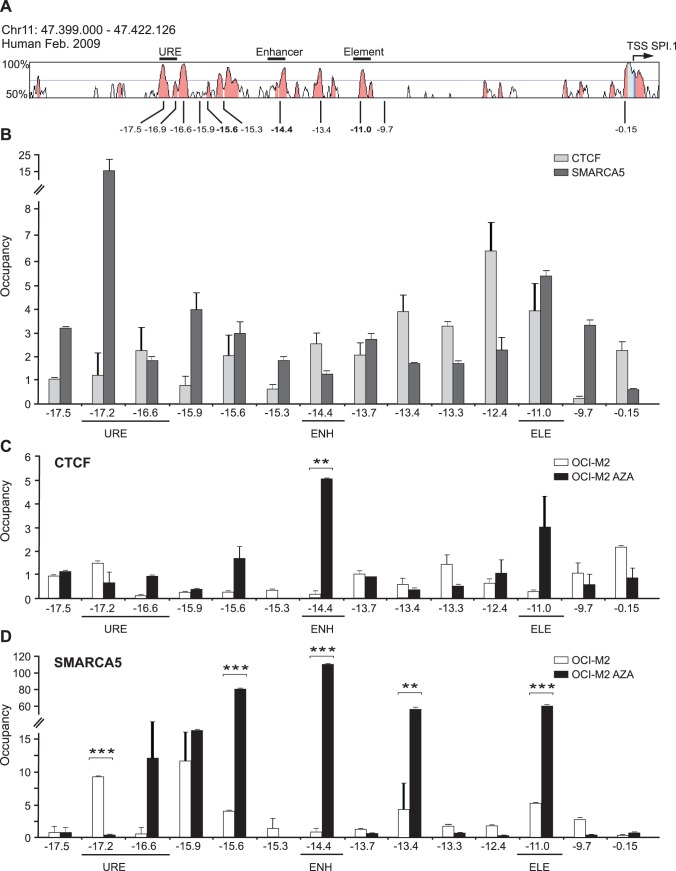
Figure 4. CTCF/SMARCA5 are recruited to SPI1 locus in myeloid cells and upon AZA treatment in AML.
A: Sequence conservation of human SPI1 locus (VISTA) generated by aligning with murine DNA. Regulatory regions and positions of ChIP amplicons are numbered in respect to human SPI1 TSS. B: ChIP of CTCF and SMARCA5 in mixed myeloid cells. C: ChIP of CTCF and D: SMARCA5 in OCI-M2 without (OCI-M2) or with AZA (OCI-M2 AZA) treatment. Y-axis: ChIP enrichment. X-axis: amplicons (distance relative to SPI1 TSS). URE, Upstream Regulatory Element of SPI1 gene; ENH, enhancer; ELE, element. Error bars: the standard errors (SE). Asterisks: p-values (t-test, 0.05–0.005).

