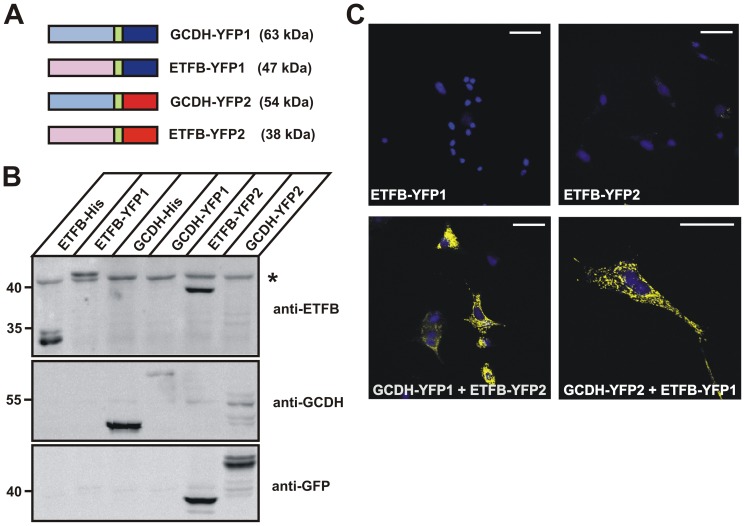
Figure 6. Interaction of GCDH with ETFB in vivo.
(A) Schematic representation of GCDH and ETFB fusion proteins with YFP1 (dark blue) and YFP2 (red). The 10-amino acid linker (GGGGS)2 is indicated in green. The calculated molecular masses of the respective fusions proteins are shown in brackets. (B) The expression of the various fusion proteins used in this study were analyzed by western blotting. The 43 kDa band (*) reactive with the anti-ETFB antibody is unspecific. (C) Fluorescence microscopy of fixed BHK cells co-expressing GCDH and ETFB fusion proteins showed a strong YFP fluorescence. Nuclei were visualized using DAPI (blue). Scale bars = 40 µM. Representative images of n = 3 independent transfection experiments are shown.

