
Figure 9. Electrostatic potential map on the adsorption of B4010 and B4010_R1A with bilayer.
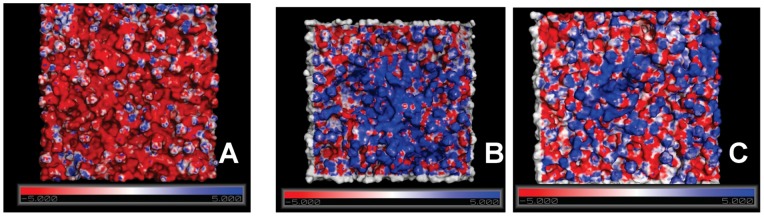
(A) POPC/POPE/POPS/Erg bilayer (B) B4010-adsorbed bilayer and (C) B4010_R1A-adsorbed bilayer. The negative and positive surfaces are labeled in red and blue, respectively whereas grey color indicates neutral surface.