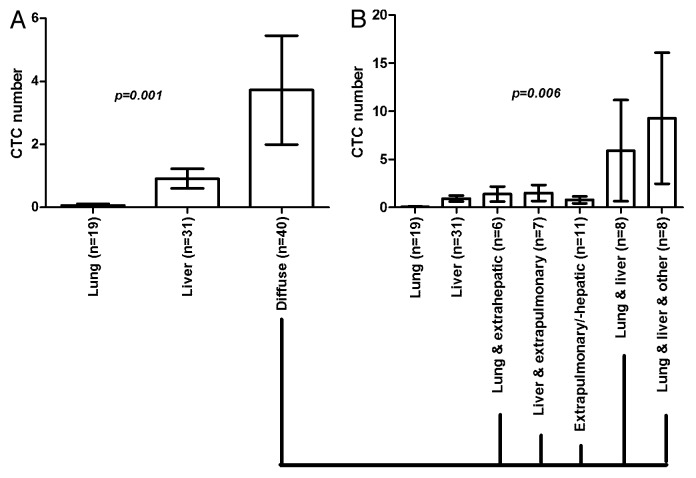
Figure 1. Bar graphs showing different metastatic spread patterns in 90 stage IV CRC patients, as determined by biopsy results and imaging. CTCs were determined in 7.5 ml of blood by EpCAM-based and FDA-approved CellSearch® analysis. (A) Patients with diffuse metastases had significantly higher CTC numbers than patients with metastases limited to the lung or liver. (B) Represents subclassification of the metastatic patterns in patients with diffuse metastases. Analysis revealed that patients with lung and liver metastases, and patients with lung and liver and additional extrapulmonary/-hepatic disease had the highest CTC numbers, in contrast to patients with isolated lung or liver, or absence of lung or liver metastases. Patient numbers are provided in brackets. Shown are mean values with standard error of the mean (SEM). P values were calculated by nonparametric Kruskal–Wallis test.

An official website of the United States government
Here's how you know
Official websites use .gov
A
.gov website belongs to an official
government organization in the United States.
Secure .gov websites use HTTPS
A lock (
) or https:// means you've safely
connected to the .gov website. Share sensitive
information only on official, secure websites.
