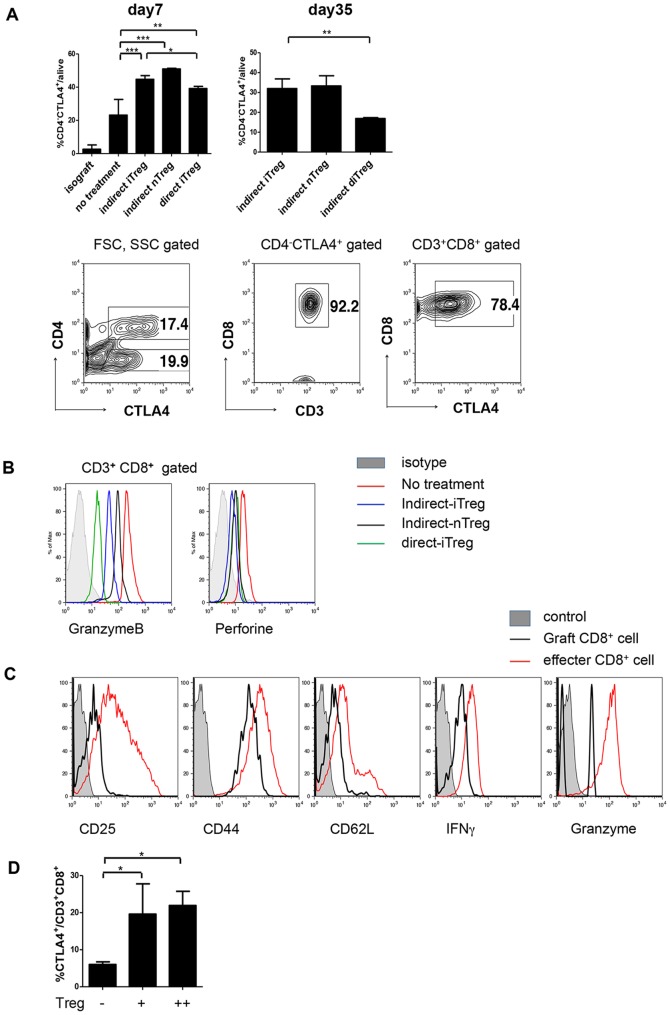
Figure 6. CTLA4+CD8+ cells in filtrated cardiac grafts.
A, (upper panels) Fraction of CD4−CTLA4+ cells in mononuclear CD3+ cells in the grafts on day 7 and days 35–40 after transplantation (n = 3–5). *** P<0.01 ** P<0.03 (lower panels) FACS analysis of CTLA4+ cells in the graft of indirect-iTreg-treated mice on day 35 after transplantation. B, Histograms of CD3+CD8+ cells harvested from cardiac grafts 14 or 15 days after transplantation in mice treated with the indicated Tregs. C, Comparison of the expression of cell surface marker and cytokines between infiltrated CD8+ cells in indirect-iTreg-treated grafts on day 35, and effector CD8+ cells induced in vitro. Effector CD8+ cells were induced from naïve CD8+ T cells from CBA cultured with BMDCs from C57BL/6 mice (MLR). D. Induction of CD8+CTLA4+ cells. Using 96-well U-bottom plates, naïve CD8+ T-cells (2×10⁴/well, CBA) were cultured with 15 Gy-irradiated BMDCs (2×10⁴/well, C57BL/6) in either the presence or absence of direct-iTregs induced in vitro (4×10⁴/well (+) or 8×10⁴/well (++), CBA), as described above. After 5 days, the cells were analyzed using a FACSCanto. (* P<0.05, Bonferroni's Multiple Comparison Test).

