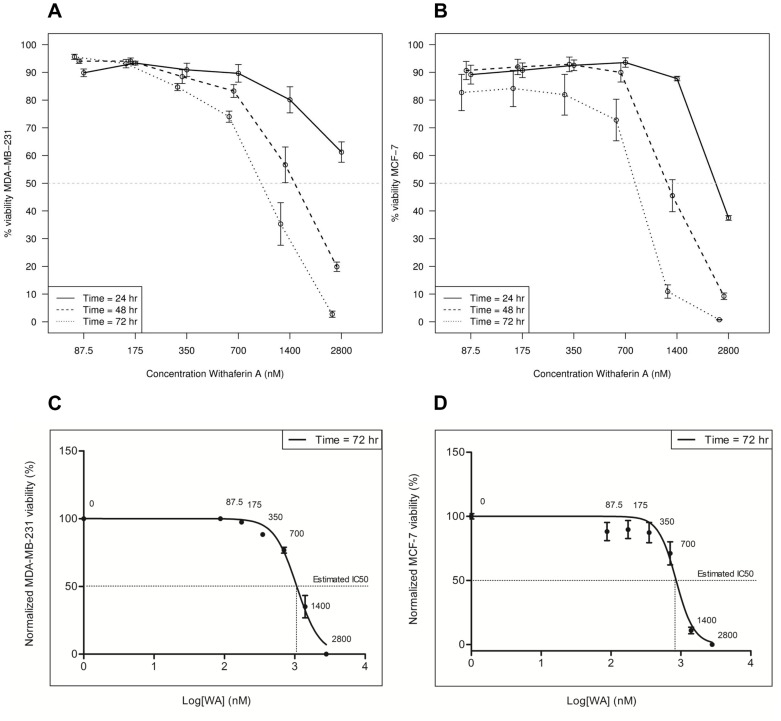
Figure 1. Effect of WA treatment on MDA-MB-231 and MCF-7 cell viability.
(A–B) Dose-response curves of GelRed™ positive/negative MDA-MB-231 and MCF-7 cells treated every 24 hours with increasing concentrations of WA for a total time of 24, 48 and 72 hours as determined by FACS analysis. Data represent (mean ± SEM) values of three independent experiments. Observed IC50 values for each time point are marked with a dashed line. (C–D) Estimation of IC50 values at 72 hours exposure time was performed in GraphPad Prism version 5.00 for Windows using dose-response curve fitting (log(inhibition) vs normalized response (variable slope)) of MDA-MB-231 and MCF-7 cells treated every 24 hours with different doses of WA for a total time of 72 hours. Observations were normalized to a DMSO control, here represented as 100% viability.

