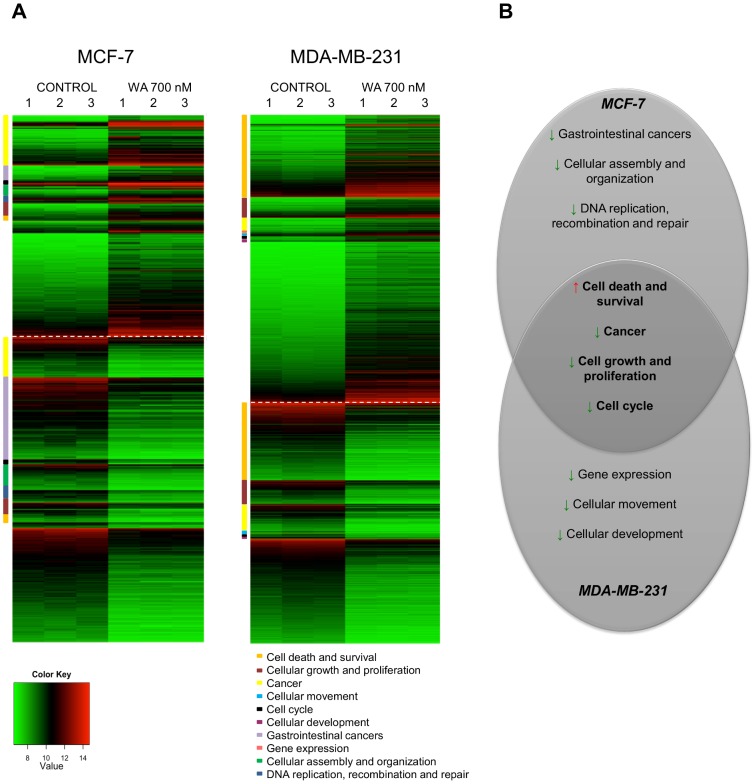
Figure 2. Biological processes affected by WA treatment in MDA-MB-231 and MCF-7 cells.
(A) The heatmap represents gene expressions for control and WA 700 nM treated MDA-MB-231 and MCF-7 cells. Only genes that have a log2 fold change (FC)≥1 or ≤1 between control and WA-treated samples and have a p-value<0.001 are plotted. Genes that are upregulated in treated samples are plotted above the dashed line (FC≥1), those that are downregulated in treated samples are plotted below (FC≤1). Genes that belong to a specific IPA biological process are clustered and represented by a colored square next to the heatmap. Color key legend represents log2 normalized expression values ranging from green (low expression) to red (high expression). (B) Venn diagram represents common and cell line-specific IPA biological processes with predicted activation state (Red arrow represents increase of a biological process- Activation Z-score≥2; Green arrow represents decrease of a biological process- Activation Z-score≤-2).

