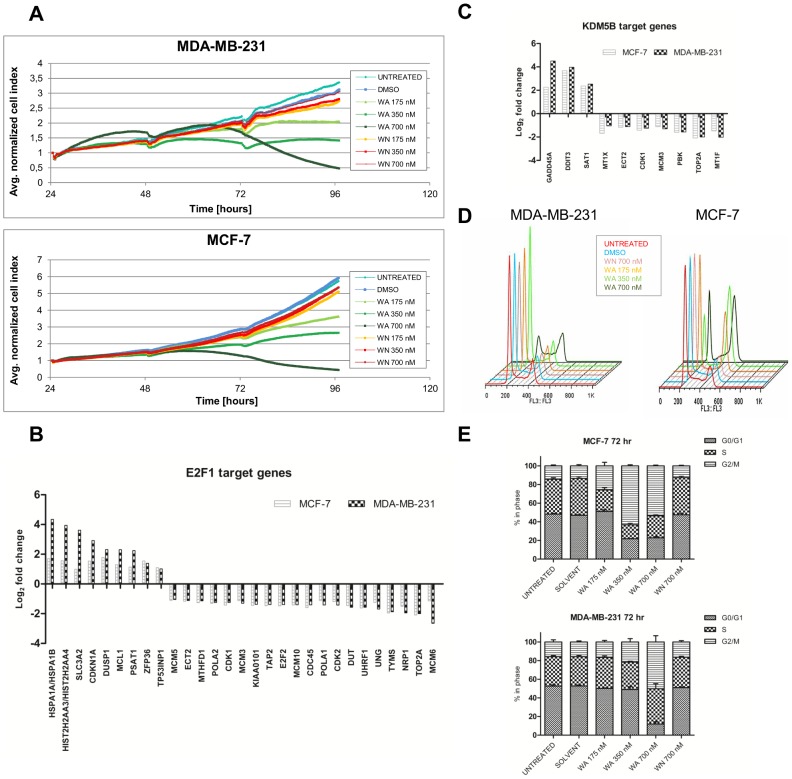
Figure 3. Anti-proliferative activity of WA in MDA-MB-231 and MCF-7 cells is related to cell cycle arrest.
(A) Real-time proliferation curves as determined by xCELLigence RTCA. Changes in an average normalized cell index of MDA-MB-231 and MCF-7 cells left untreated or treated with solvent control, WA or WN were monitored continuously for 96 hours (24 hours before treatment + 72 hours after treatment with the compounds). Graphs represent mean values from three independent experiments starting at the time of the treatment. (B–C) Bar graphs represent mean log2 fold change from three independent experiments of E2F1 and KDM5B target gene expressions of 700 nM WA-treated MDA-MB-231 and MCF-7 cells relative to non-treated control samples as determined by Human HT-12 v4 BeadChip Gene Expression Array. (D) Analysis of the different cell cycle phases was performed by flow cytometry following Vindelov labeling procedure with propidium iodide. Representative flow histograms of MDA-MB-231 and MCF-7 cells treated for 72 hours with WA or WN compared to solvent control and untreated cells are presented. (E) Grouped bar graphs represent quantification of different cell cycle phases by FlowJo software using Watson Pragmatic model. Data represent (mean ± SEM) values of three independent experiments.

