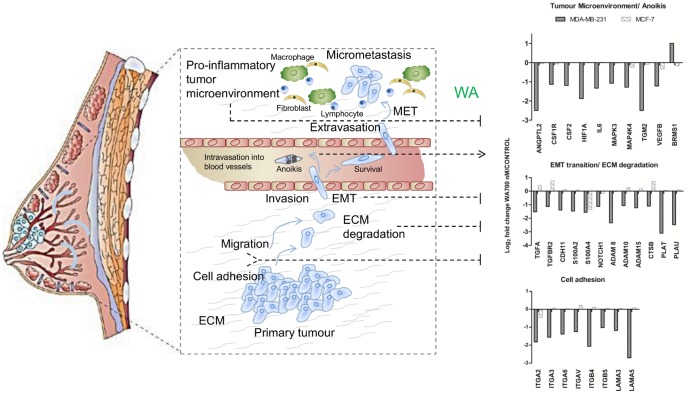
Figure 4. Impact of WA on several essential steps of the metastatic cascade in MDA-MB-231 cells.
Graphics is a modified version of Figure 1 from [65]. Bar graphs represent mean log2 fold change from three independent experiments of metastasis target gene expressions of 700 nM WA-treated MDA-MB-231 and MCF-7 cells relative to non-treated control samples as determined by Human HT-12 v4 BeadChip Gene Expression Array.

