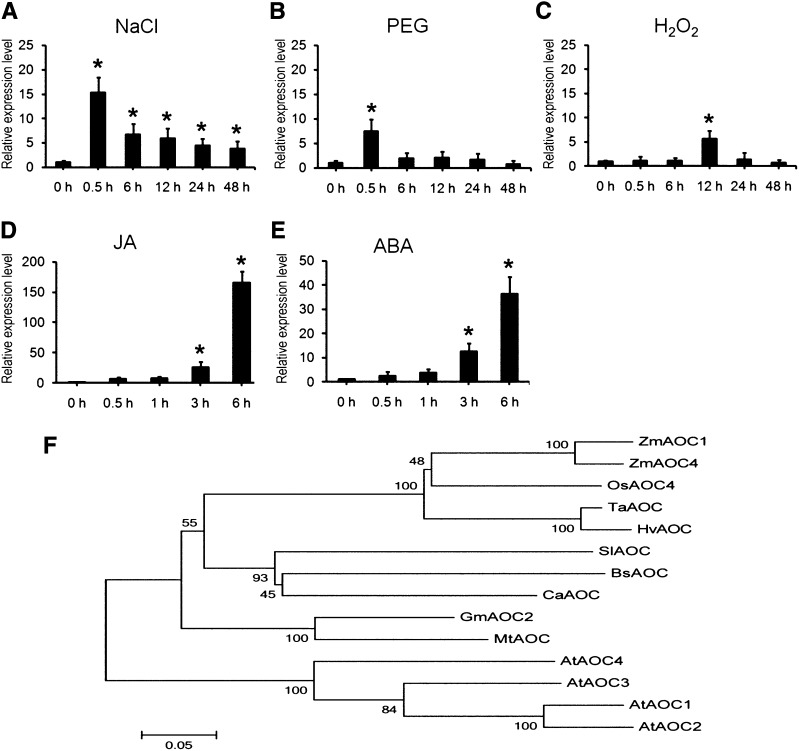
Figure 1.
TaAOC1 expression under treatments in wheat ‘SR3’ plants and phylogenetic analysis of AOCs from different plant species. A to E, The expression levels of TaAOC1 in wheat ‘SR3’ plants under 200 mm NaCl treatment (A), 20% (w/v) PEG treatment (B), 10 mm H2O2 treatment (C), 100 µm JA treatment (D), and 100 µm ABA treatment (E) were determined by qPCR using wheat actin gene (AB181991) as the internal control. The expression levels at 0 h were set at 1.0. Error bars represent the sd from three biological replicates. Each replicate contained at least 30 plants. F, Phylogenetic tree. Zm represents maize, Os represents rice, Ta represents wheat, Hv represents barley, Sl represents Solanum lycopersicum, Bs represents Bruguiera sexangula, Ca represents C. acuminate, Gm represents Glycine max, Mt represents Medicago truncatula, and At represents Arabidopsis.

