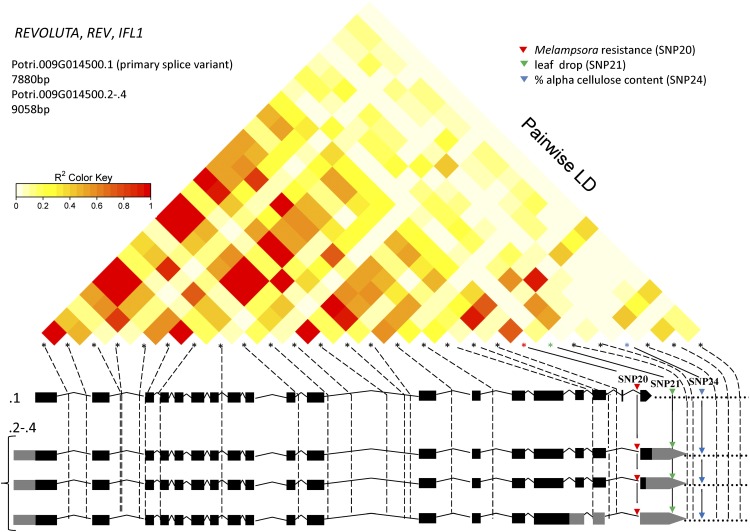
Figure 1.
PtREV gene structure, LD plot, and SNP locations. The gene structures for splice variants/transcriptional variants of REV (Phytozome version 3) are presented schematically as exon (black boxes), intron (lines), UTR (gray boxes), and noncoding (dots) at the bottom. Locations of 27 genotyped SNPs are shown as asterisks above the gene models; the solid lines connect to the genetic associations of tag SNPs within the specific splice variants with Melampsora spp. rust fungus resistance (SNP20), leaf drop (SNP21), and percentage of α-cellulose content (SNP24); dashed lines indicate SNPs with no significant association with phenotype. The LD relationships of the SNPs are shown at the top and are color coded to show the extent of LD between genotyped SNPs. r2, Squared correlation coefficient. Principal component analysis was used to adjust for population structure in the analyses of wood traits and leaf rust resistance (La Mantia et al., 2013; Porth et al., 2013a); the “area under the disease curve” resistance measure was adjusted for date of bud set prior to association analysis (La Mantia et al., 2013); Q matrix population structure correction was applied for phenology traits that covary with latitudinal population structure (A.D. McKown, unpublished data).

