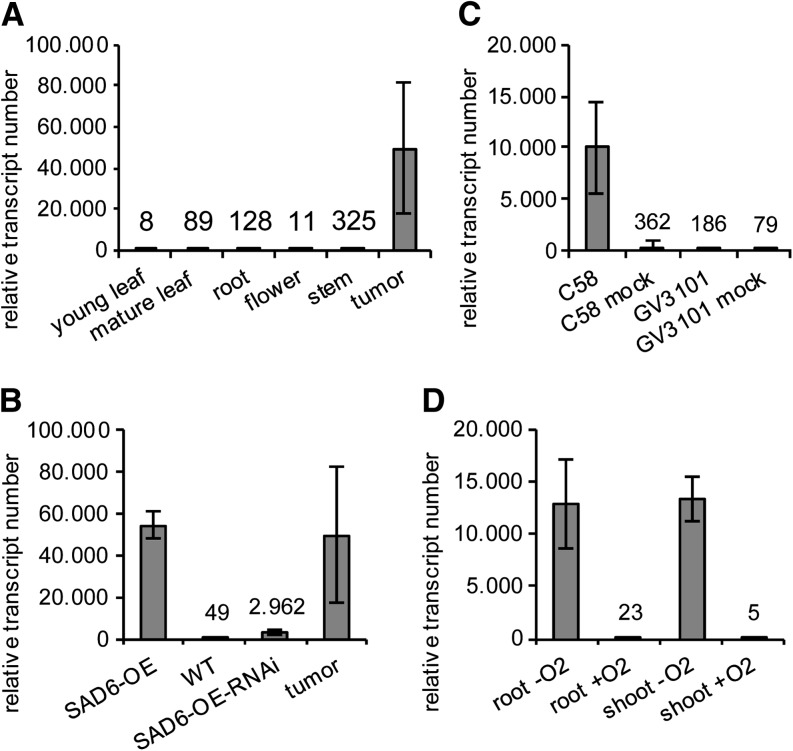
Figure 3.
SAD6 gene expression levels in different Arabidopsis tissues and after various treatments. Relative SAD6 transcript numbers are shown for different organs and the crown gall tumors induced by A. tumefaciens (strain C58) on Arabidopsis (Ws-2) stems (A), in young leaves of SAD6-OE plants, the Col-0 wild type (WT), SAD6-OE-RNAi plants, as well as crown gall tumors (B), in stems 6 d post injection of the oncogenic (C58) and nononcogenic A. tumefaciens strain GV3101 and stems injected with the respective cultivation medium serving as a mock treatment (C), and in shoots and roots treated with low (0.5% oxygen; −O2) and ambient (+O2) oxygen concentrations for 24 h (D). Relative SAD6 transcript numbers were determined and normalized to 10,000 ACTIN2/ACTIN8 molecules by applying quantitative real-time PCR. Bars and numbers above the bars represent mean values ± sd of three to four independent experiments.

