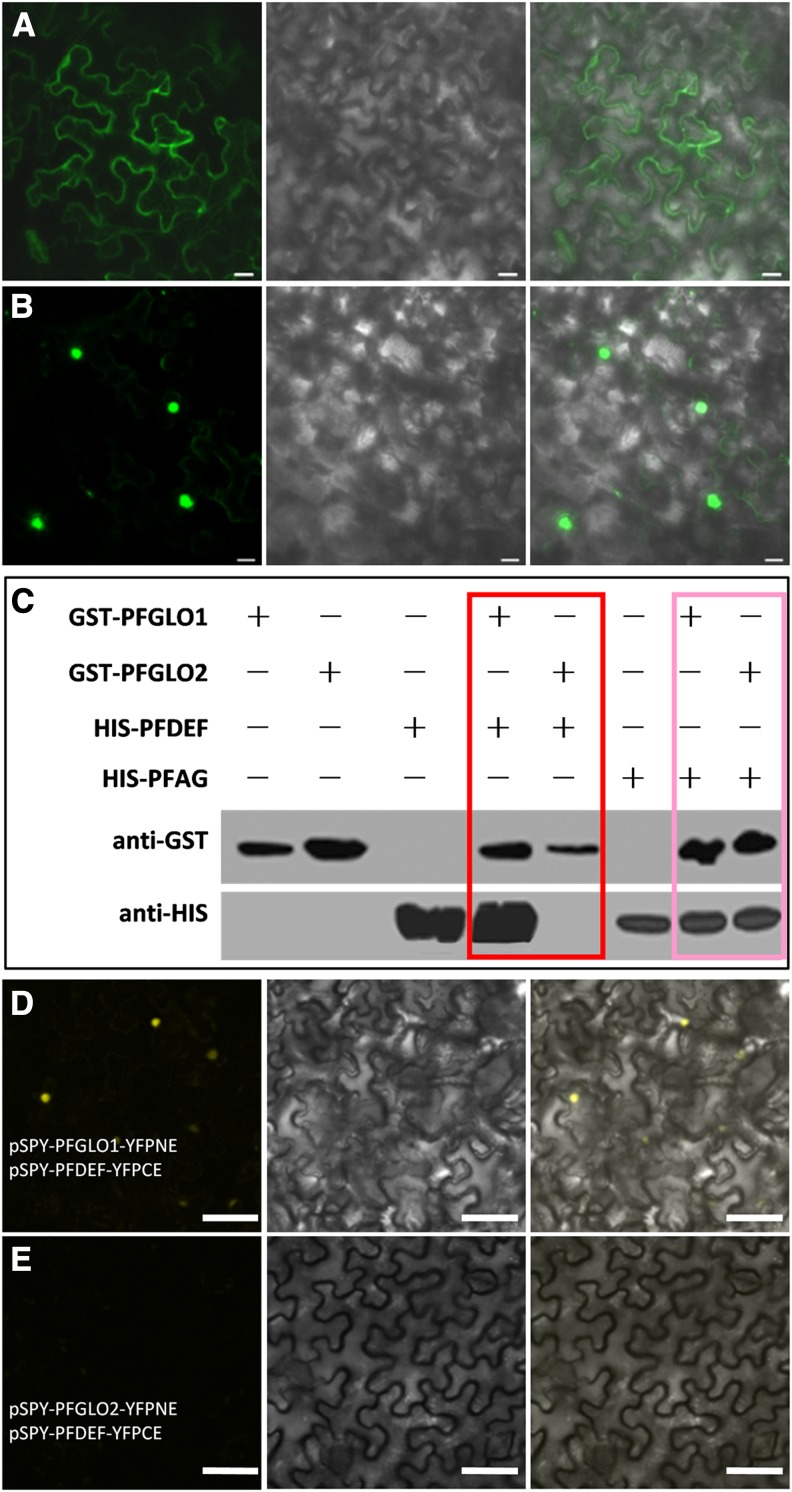
Figure 6.
Subcellular localization of PFGLO1 and PFGLO2 and characterizations of their interacting proteins. A and B, Subcellular localization of PFGLO1 and PFGLO2, respectively. From right to left in both A and B are images with green fluorescence, light images, and the merged images. Bars = 20 µm. C, Pull-down assay to confirm that PFGLO1 and PFGLO2 interact with PFDEF and PFAG, respectively. Their interactions with PFDEF are highlighted in the red box, and their interactions with PFAG are highlighted in the pink box. Other lanes are controls. D, PFGLO1 interacts with PFDEF in BiFC. E, Coexpression of PFGLO2-YFPNE and PFDEF-YFPCE. Bars = 50 μm.

