Figure 8.
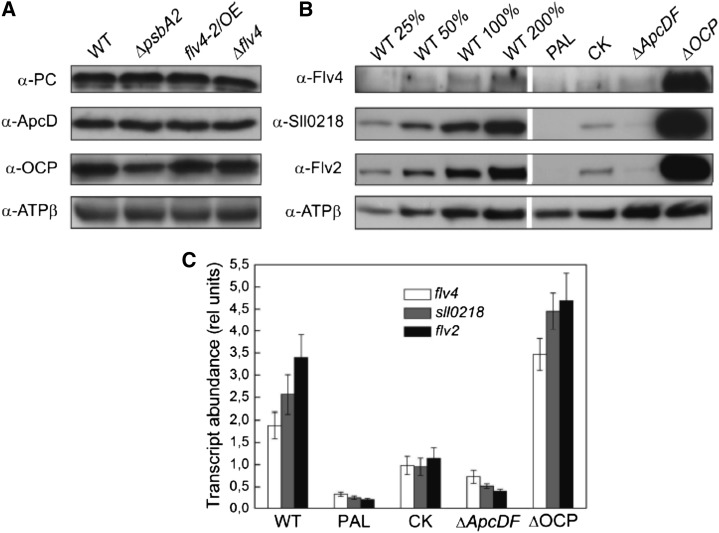
A, Protein immunoblots showing the content of ApcD, PC, and OCP in wild-type, ΔpsbA2, flv4-2/OE, and Δflv4 strains. Ten micrograms of total protein from the cell extract were loaded in each lane. B, Protein immunoblots showing the content of Flv4, Sll0218, and Flv2 in wild-type, PAL, CK, ΔApcDF, and ΔOCP mutants. Twenty micrograms of total protein from the cell extract were loaded in each lane (= 100%), if not otherwise stated. This is a representative picture of three independent immunoblots. C, Transcript accumulation of flv4-2 operon in the wild-type, PAL, CK, ΔApcDF, and ΔOCP mutants analyzed by real-time quantitative RT-PCR. Transcript abundance is shown as relative units. The transcript level of the rnpB gene is used as a reference. The results are the mean from three independent experiments ± sd. ApcD allophycocyanin D; PC, phycocyanin; rel unit, relative unit; WT, wild type.

